 Every year, several hundred million hectares of forest, grasslands, and other types of vegetation burn throughout the world, and this amount is set to increase due to climate change. Wildfires pose a challenge for ecosystem management because they can be both harmful—threatening human life, property, economic activity and contributing to climate change—and beneficial—by regulating plant succession and fuel accumulation, affecting populations of insects and diseases, influencing nutrient cycles, and in many other ways we still struggle to understand.
Fires produce electromagnetic effects that can be detected with the use of remote sensing techniques. Remote sensing as applied for fire prevention and management involves three sets of variables: the phases of a fire (pre-fire conditions, active fire, post-fire burn area), the sensors (optical, thermal infrared, lidar, radar, and microwave—which can be satellite-based, airborne, or ground-based), and the key variables to be estimated and mapped (vegetation type, topography, ground fuel, and weather, especially wind speed and direction). Before a fire, remote sensing helps with risk analysis, mitigation, and prevention planning; once a fire starts, it helps to detect it and with incident response and management; after a fire, it helps to map burnt areas. Each sensor has its strengths and weaknesses. The best solution is often a combination of two or more sensors and of space-based or airborne remote sensing with ground-based surveys.
In response to last year’s devastating High Park wildfire, in Colorado, scientists from the Warner College of Natural Resources at Colorado State University (CSU) began to lead a large-scale wildfire impact study in partnership with a new research facility, the National Ecological Observatory Network (NEON), based in Boulder, Colorado. NEON intends to build 60 sites across the United States that will gather and synthesize continental‐scale data over 30 years on the impacts of climate change, land use change, and invasive species on natural resources and biodiversity and make it freely available in near real-time to scientists, educators, students, decision makers, and the public.
“Fuel, topography, and weather are the three critical components to understanding how fires behave,” says David Buckley, Vice President for GIS Solutions at DTSGIS, which develops software solutions to support fire risk analysis and fire fighting. “There are detailed data for each of those and they are all combined to generate an output that will identify different conditions of threat, or probability of a fire occurring, and risk, which is the possibility of loss or harm occurring from that fire.”
The amount of fuel on the ground changes only with large disturbances, such as urban growth, or very locally, such as when people clear vegetation around their homes. Topography, of course, does not change on human time scales, except in the case of large construction or landscaping projects. Therefore, the only variable that needs to be measured in real time is weather.
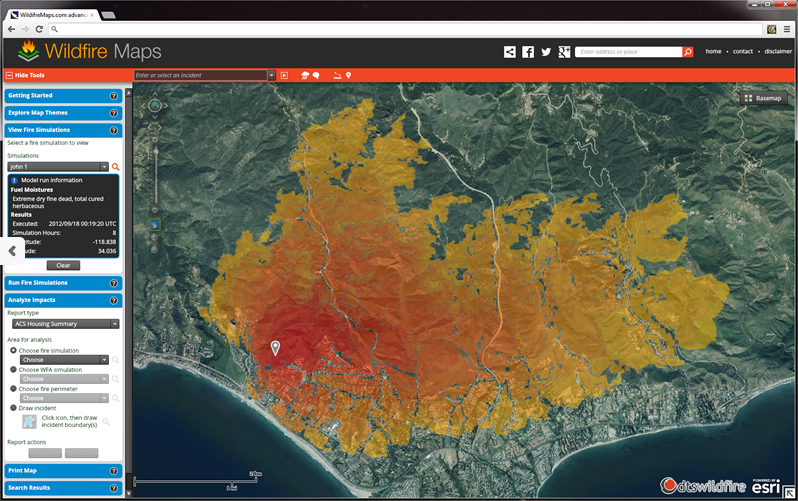
DTSGIS provides a suite of tools that include incident management, wildfire analysis, and public-facing tools to explore incidents (http://www.dtswildfire.com/).
“Remote sensing instruments can provide information on drought conditions, water content, fuel properties, and the state of the vegetation,” explains Tom Kampe, NEON’s Assistant Director for Remote Sensing. “Many of these systems also provide information on local weather.”
Fuel type can be mapped, like classical vegetation mapping, from optical or radar images with high spatial resolution. Whether wildfires will ignite and, if they do, how they will spread, depends also on fuel moisture, which can also be estimated by remote sensing.
Different types of sensors can be used to estimate fuel moisture, says Brigitte Leblon, professor of remote sensing at the Faculty of Forestry and Environmental Management, University of New Brunswick, Canada, who specializes in studying that parameter. Optical sensors deployed by NOAA (National Oceanic and Atmospheric Administration), such as the AVHRR [Advanced Very High Resolution Radiometer], or by the LANDSAT, MODIS (Moderate Resolution Imaging Spectroradiometer), or SPOT missions, she explains, enable the production of NDVI (Normalized Difference Vegetation Index) images that show how green the vegetation is: the less green it is, the more it is likely to burn. “However, greenness changes could also be due to insect infestation, fungi, or something else, so, it is not a very good indicator of fuel moisture. NOAA’s AVHRR and LANDSAT have also thermal infrared bands that allow measuring temperature increases that are produced when the surfaces are getting dryer. However, in both cases, the image acquisition is limited to clear sky conditions, which is not the case of radar sensors like the one on board of the Canadian RADARSAT satellites or the European ENVISAT satellites. They can be used to estimate fuel moisture because radar responses relate directly to the dielectric properties of the area and thus to its moisture.”
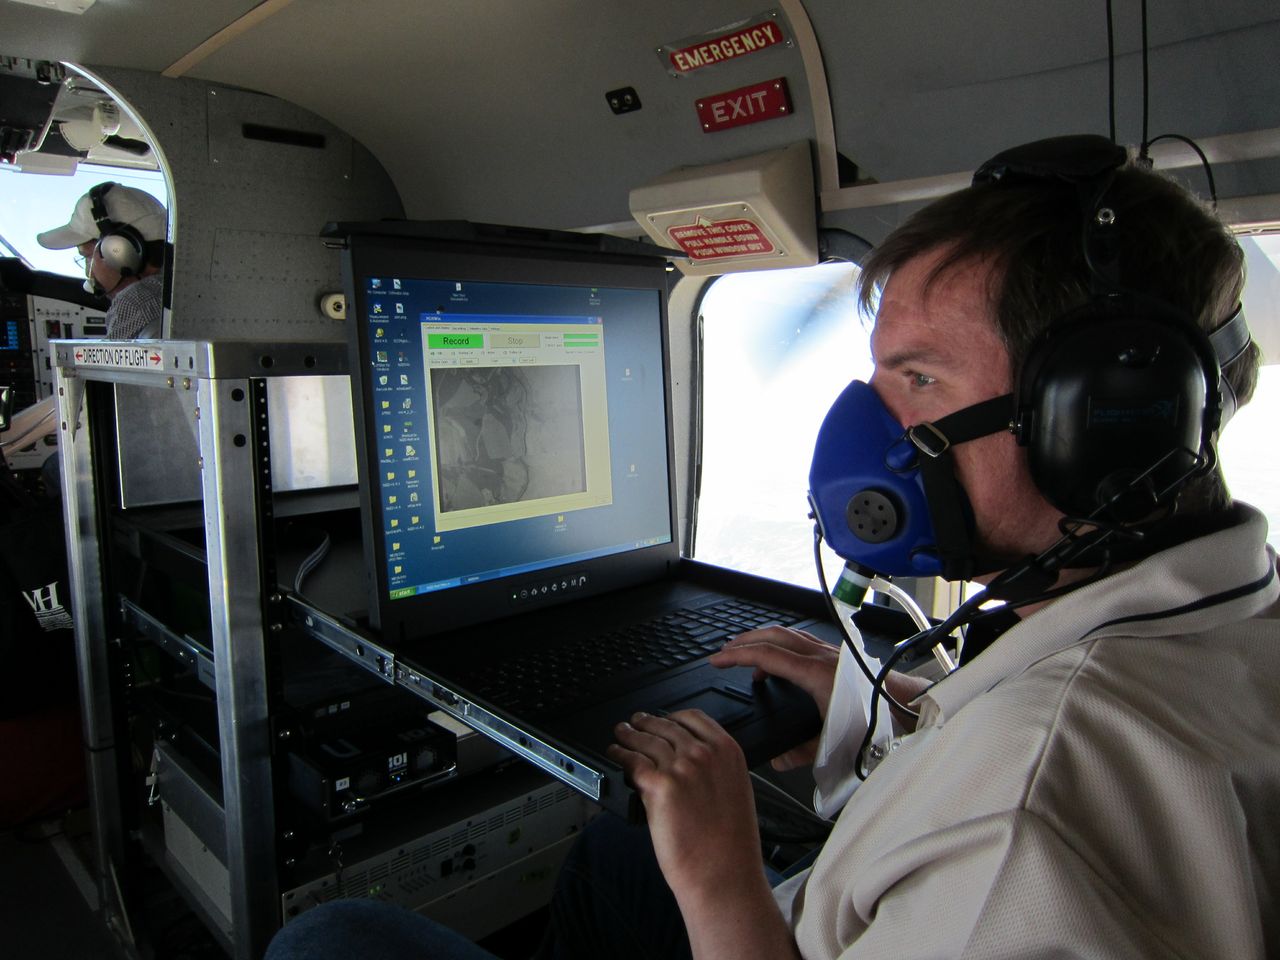
Instrumentation Scientist Bryan Karpowicz monitors AOP instrumentation on a laptop during a test flight. Photo by Keith Krause, NEON
The U.S. federal government’s multi-agency LANDFIRE project provides data on pre-fire conditions, typically at the 30 meter level. All of these variables are used as inputs into fire danger predicting systems, such as the U.S. National Fire Danger Rating System (NFDRS), which also take into account other pre-fire conditions, such as proximity to roads and to populated areas. Airborne lidar can provide additional data on vegetation types around specific assets or structures, such as homes or electric utility infrastructures.
“Risk assessment and preparedness planning does not use real-time data,” says Buckley. “While it has to be up-to-date, reflecting the current conditions on the ground, we use historical percentile weather data to generate those risk analysis.”
For fire fighting, early detection is essential. It currently relies on human observation, fixed optical cameras, and aerial surveys, but not on satellite sensors because of their long revisit time. For detection, Leblon explains, it is best to rely on a combination of optical and thermal sensors—the former because a fire produces visible smoke and the latter to acquire the hot spot. However, smoke is detectable only some time after a fire has started and often it is conducted along the surface and emerges far from where the fire started.
Once a fire is progressing, optical or radar sensors can be used to map the burn area. “Radar is better because you can see through the smoke,” says Leblon. “At this level, the two are very complementary. The best approach is with three sensors: optical, radar, and thermal infrared. NASA planned to have a satellite with all three, but it never happened. Thermal infrared is always coupled with optical. We can get the optical data easily, for free—for example, from MODIS, Landsat, or NOAA-AVHRR. All three also have a thermal band, so you often have the two together.” MODIS has become the standard data source for monitoring fires at regional to global scales and is used for environmental policy and decision-making.
Besides detection and mapping, incident commanders need to predict as best as possible a fire’s behavior—such as where it is most likely to spread and where the greatest flame length or intensity are most likely to occur—in order to decide where to allocate crews and which areas to evacuate. “A component of that is the ability to simulate the growth of the fire, let’s say over the next four, eight, or 12 hours, and show them where it is likely to go given current and forecasted weather,” says Buckley. “For real-time fire fighting, they use many thermal sensors for capturing where the hot sparks of a fire are and where it is through the smoke. Many of the larger state and federal agencies regularly use thermal imagery during significant fire scenarios.”
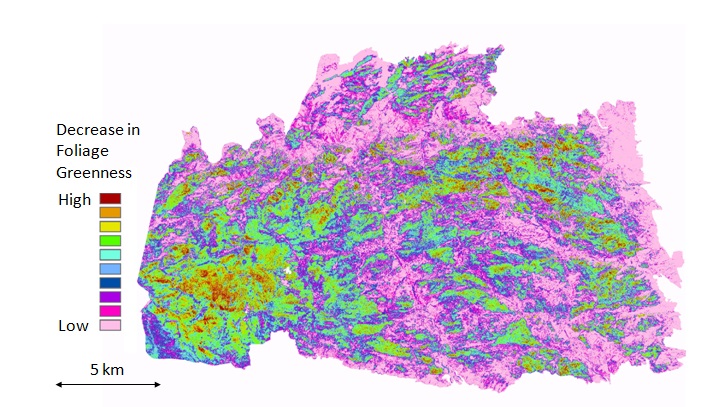
Fire severity expressed as decrease in foliage greenness (Normalized Difference Vegetation Index) between Sept. 17, 2009 and Oct. 17, 2012. Courtesy of Michael Lefsky, Center for Ecological Applications of Lidar, Department of Ecosystem Science and Sustainability, Colorado State University.
Three other critical types of real-time data are wind speed, wind direction, and humidity, especially in narrow valleys that create their own microclimate. “Many incident management teams use mobile remote weather stations to capture more detailed weather information on what is occurring in those valleys,” says Buckley. “It’s all about how quickly you can get accurate information.”
To observe fire behavior, microwave has the advantage that it is able to penetrate clouds and smoke, points out Michael Lefsky, an assistant professor in CSU’s Department of Forest, Rangeland, and Watershed Stewardship and the principal investigator on the High Park fire. “Thermal infrared is also valuable during a fire, because ground temperature and canopy fire temperature are primary pieces of information that you want.”
Mapping of burnt areas and assessment of wildfire effects is another successful application of satellite remote sensing. Fires cause significant changes in the structure and reflectance of vegetation and in soil properties within these areas that can be seen in the microwave, visible, and infrared parts of the electromagnetic spectrum. NASA provided a new capability for regional mapping of burnt areas when it launched the MODIS sensor on board its TERRA and AQUA satellites, but imagery from the Landsat Thematic Mapper has also been used, complemented in some cases by the SPOT (Système Pour l’Observation de la Terre) satellite and ASTER (Advanced Spaceborne Thermal Emission and Reflection Radiometer).
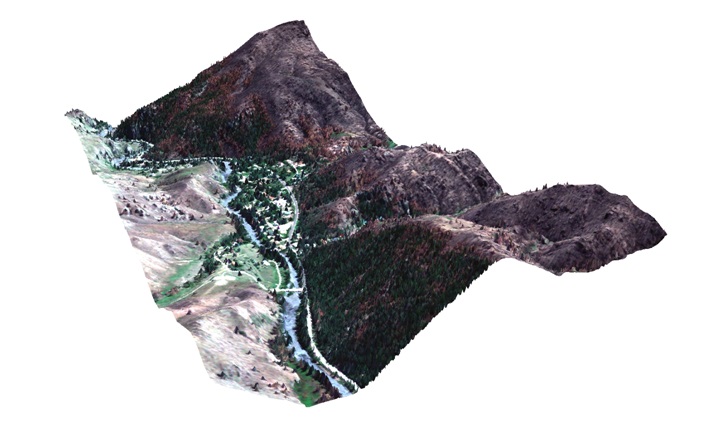
Multispectral RAPIDEYE imagery overlain over lidar digital terrain model derived from NEON lidar. Courtesy of Michael Lefsky
“Post-fire, the fire burn area and the regeneration can be obtained with optical and radar sensors,” Leblon explains. “When you have the vegetation coming back, the greenness of your area increases, so you get this on optical; once the vegetation is back, the surface roughness changes and the radar picks it up.” Radar works very well to detect burn areas in permafrost, because a fire changes the ice to water.
Satellite imagery provides extensive regional coverage with zero disturbance of the area viewed and enables data acquisition in less accessible areas on a regular and cost effective basis. “On foot, you can cover only so much area and get an isolated snapshot of what’s going on,” says Kampe. “Coupling that with the remote sensing information gives you the broad view of what is happening over the entire area.”
“The advantage of optical sensors is that they are free of charge,” Leblon points out. “For example, the U.S. Geological Survey provides georeferenced Landsat images free of charge that can be used directly without doing any fancy image processing. The major problem is the cloud cover. When you have a big fire, you can have a lot of smoke and you cannot see anything, because the smoke covers the area. So, a major problem with optical and thermal infrared is that they cannot acquire under cloudy conditions, they require a clear sky. Airborne data is very costly. Lidar, for example, is only airborne and it costs $300 per square kilometer. With radar data, even if it is from a commercial satellite, it is only $4 per square kilometer, because the satellite is already there and the big bill was paid by the country that built it.”
The tradeoffs between optical, thermal infrared, and microwave sensors have to do with the ability to detect the fires and with spatial resolution, or how fine-scale we can actually see things, explains Kampe. For example, he points out, NASA’s satellite-based MODIS has pixel size between 250 meters and one kilometer, which limits the ability to detect small fires. Furthermore, because it is an infrared system, it does not transmit through clouds, which, if it is very cloudy or smoky, may make it impossible to estimate the extent of fires or to detect them at all.
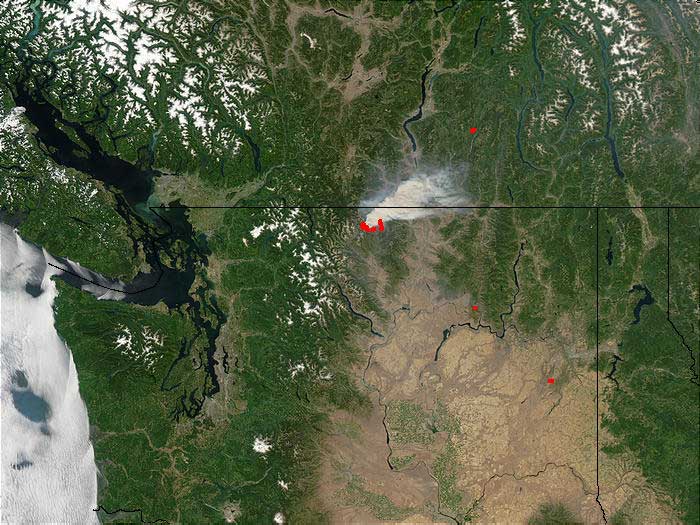
MODIS provides the “big picture” view with daily fire activity monitoring. Credit: NASA
Like MODIS, ASTER, which was built by the Japanese and is being flown on a NASA satellite launched in 1999, operates in the short-wave infrared portion of the spectrum. However, it is has a much smaller ground footprint of about 30 meters, so you can use it to detect small fires, Kampe explains. “The tradeoff there is that you don’t get global coverage in a day. It takes quite a number of days to be able to revisit the same point on Earth.”
Microwave sensors can penetrate through clouds and vegetation, enabling detection of a fire that may be occurring in a forest in the understory. However, they are expensive and have even less spatial resolution than MODIS.
Although radar is theoretically able to acquire imagery regardless of the weather conditions, the availability of this sensor is often limited because of the longer repeat cycle of the satellites. Additionally, while radar images have a finer spatial resolution than optical or thermal infrared images, they cover a smaller area. Thus, radar data is complementary to optical or thermal infrared data.
“Microwave or radar sensors are completely independent of weather conditions,” says Leblon. “You can even use them to acquire images at night. A microwave sensor is like a camera with a flash; an optical sensor is like a camera without a flash. If you have a camera without a flash, you are very limited as to the pictures that you can take; you cannot take a picture inside a building. With a microwave sensor, we have a flash and we can take a picture anywhere.”
“Radar,” Leblon continues, “has two advantages with fire: one, you can acquire images regardless of the weather conditions and, two, it relates to the fuel moisture. The signal of the radar is sensitive to the type of vegetation and to the moisture of your area. So, first you have to carefully map your land and then, for each homogeneous area, you can also get your fuel moisture.”
The study of the High Park wildfire is a joint project of NEON and CSU, in collaboration with local, state, and federal agencies and land managers. It aims to provide critical data to the communities still dealing with major water quality, erosion, and ecosystem restoration issues in an area spanning more than 136 square miles. The project integrates airborne remote sensing data collected by NEON’s Airborne Observation Platform (AOP) with ground-based data from a targeted field campaign conducted by CSU researchers. It aims to help the scientific and management communities understand how pre‐existing conditions influenced the behavior and severity of the fire and how the fire’s patterns will affect ecosystem recovery.
The aircraft‐mounted instrumentation in the AOP includes a next-generation version of the Airborne Visible InfraRed Imaging Spectrometer (AVIRIS), a waveform lidar instrument, a high-resolution digital camera, and a dedicated GPS-IMU subsystem. “Being an airborne instrument, it has the capability to resolve features as small as a meter on the ground which enables us to detect individual trees and shrubs.” says Kampe. The combination of biochemical and structural information provided by spectroscopy and waveform LiDAR can be used to observe many features of land use and to observe and quantify pest and pathogen outbreaks, responses to disturbances like wildfire, and spatial patterns of erosion and vegetation recovery.
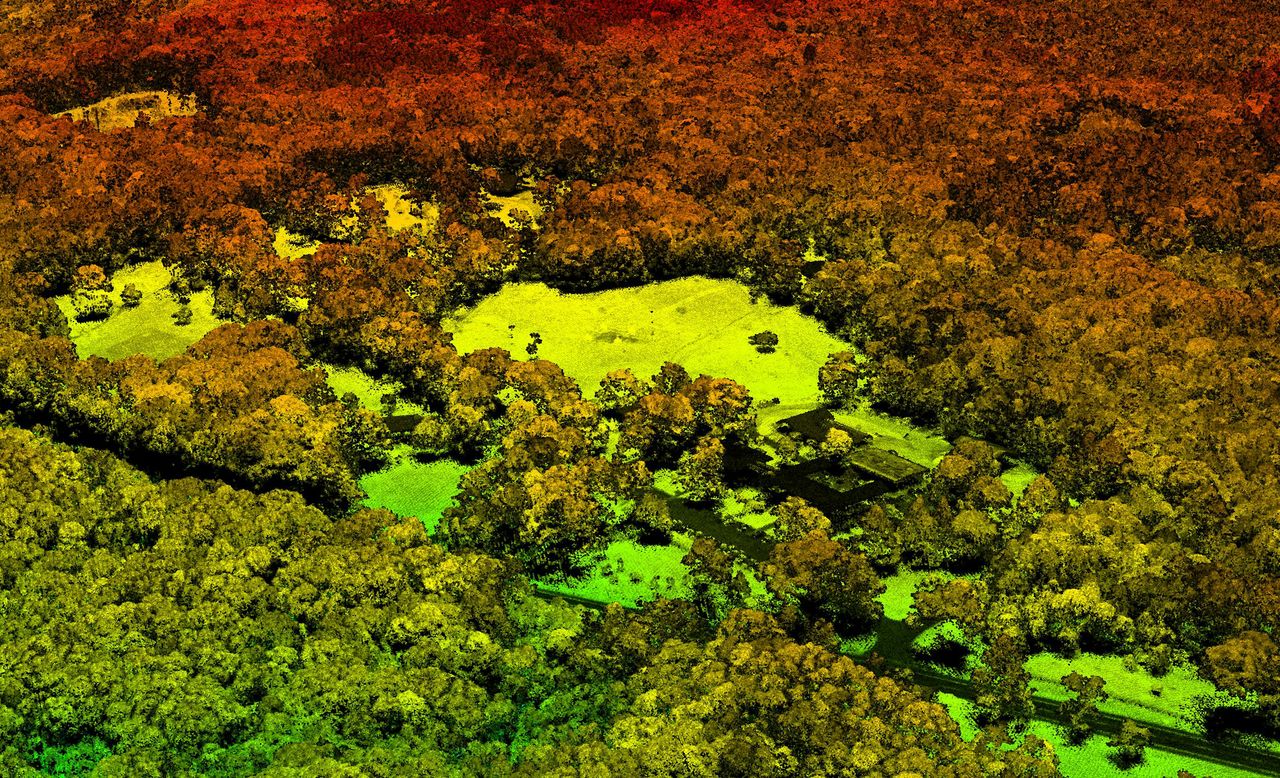
A high resolution LiDAR image from NEON airborne observation platform (AOP) test flights over Harvard Forest, Mass., summer 2011. Credit: NEON.
“We acquire the raw data and convert it into usable data for the scientific community,” says Kampe. “That’s things like geolocation, radiometric calibration—these are all intermediate steps that have to be done to make that data useful for the scientific community. In the High Park area, we weren’t trying to map the active fire but were looking at post-fire conditions. We were trying to map the entire burnt area and study the effects of the fire on vegetation and the ecology as a whole. In the long term, we hope to be able to look at post-fire recovery and the fire’s impact on the local region. We are still processing our data. The lidar data has been made available to Lefsky and his team and we anticipate that the imaging spectrometer data will be made available to him shortly.”
“We are obtaining quite a lot of information and can provide many different products,” says Kampe. “We can discriminate between ash, soil, and vegetation and between live and dead vegetation. We can characterize regions that were burnt in contrast with areas that were not. In the long term, looking at post-fire recovery, the imaging spectrometer gives us the ability to map the regeneration of vegetation and also to discriminate between different types of vegetation—trees vs. shrubs vs. grass—even to the point where we can determine, in some cases, what types of species are growing.”
“We get a map of the forest canopy itself and the ability to estimate such things as total biomass,” Kampe continues. “For post-fire areas, we use this to look at the state of the vegetation right after the fire. Then we subtract the vegetation and get a map of the bare ground. One of the things we look at, particularly in High Park, is the impact of erosion that may occur in areas that were burnt severely. Then we can also use the lidar data to map the growth in vegetation. The combination of the imaging spectrometer and the lidar makes our system and our study somewhat unique and should provide some very good information to foresters, land developers, and water resource managers.”
“We also measure the spectra of individual trees using hand-held field spectrometers to obtain ground truth spectra that we then use to derive the actual products from the airborne data,” Kampe explains. “We need to have spectra for the individual dominant species in that area. We also measure areas of ash and soil, different kinds of scrubs, that sort of thing, and then that goes into the models that we use to derive, say, the percent of a pixel that might be soil or tree. The spectrum for each pixel is a combination of the spectra of all these different things that exist on the ground. So, we need the ground truth information to separate the spectral information in our models.”
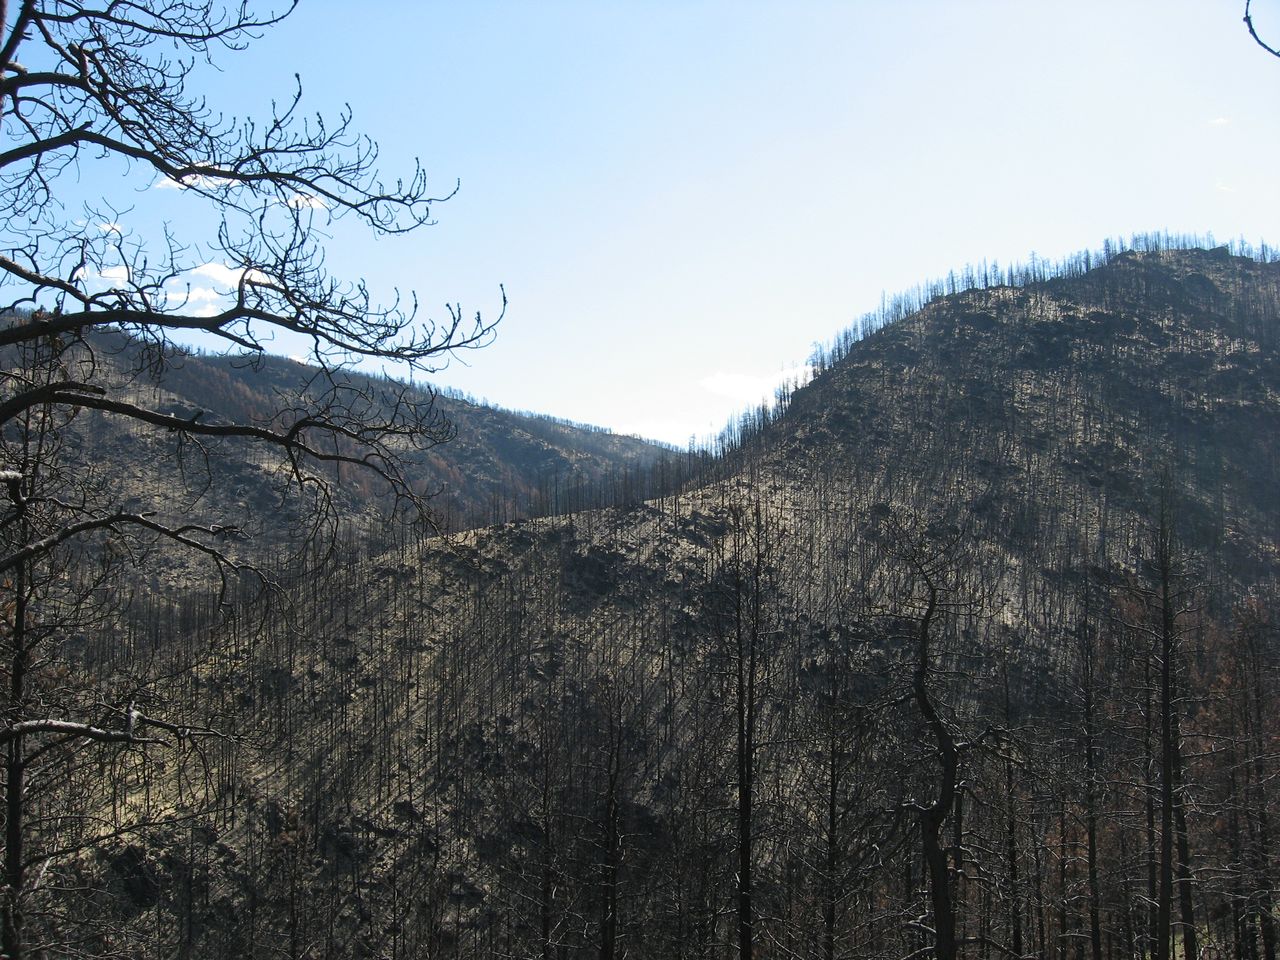
Burn area inside the High Park Fire scar, Oct. 2012. Photo by Jennifer Walton, NEON
CSU’s team conducted the remainder of the data acquisition—the ground sampling and deriving the science from those products. “The High Park fire was, both for NEON and for us, a target of opportunity,” says Lefsky. “It was near NEON headquarters and near CSU, where there’s a lot of bark ecology expertise, so, we’re really targeting the High Park fire to look at some of these questions.”
“In the field,” says Lefsky, “we collected mostly conventional forest inventory parameters. So, detailed information on the burn severity, as well as the number, size, and species of stems, ground litter distribution, understory vegetation. That’s all being used for two purposes: to calibrate the lidar data, so that we can get, indirectly, estimates of how much biomass is there before the fire, as well as assisting us with mapping of burn severity and also presence or absence of bark beetle infestation prior to the fire. There is evidence that when burn severity is moderate, the dead trees that are left by bark beetle infestation can increase the severity and the speed at which fire burns through an area. On the other hand, when fire is really going, it doesn’t seem to make much of a difference. But that is an open research question and something that we will be examining during the study.”
What conclusions have the researchers been able to draw from the study so far? “The rate of recovery of vegetation, both in the field and from remote sensing, is really quite rapid,” says Lefsky. “There are only the areas within the very most severe fire that actually don’t seem to be making marked increases in vegetation cover.”
