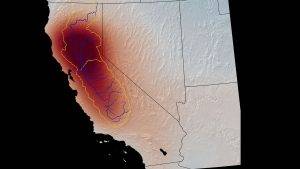
This map shows changes in the mass of water, both above ground and underground, in California from 2003 to 2013, as measured by NASA’s GRACE satellite. The darkest red indicates the greatest water loss. The Central Valley is outlined in yellow; the Tulare Basin covers about the southern third. Extreme groundwater depletion has continued to the present. (Credit: NASA/GSFC/SVS)
Scientists have produced a new method that holds the promise of improving groundwater management critical to both life and agriculture in dry regions. The method sorts out how much underground water loss comes from aquifers confined in clay, which can be drained so dry that they will not recover, and how much comes from soil that’s not confined in an aquifer, which can be replenished by a few years of normal rains.
The research team studied California’s Tulare Basin, part of the Central Valley. The team found that the key to distinguishing between these underground sources of water relates to patterns of sinking and rising ground levels in this heavily irrigated agricultural region.
The Central Valley makes up only 1 percent of U.S. farmland, yet it grows an amazing 40 percent of the nation’s table fruits, vegetables and nuts annually. Productivity like that is only possible because farmers augment the valley’s 5 to 10 inches (12 to 25 centimeters) of annual rainfall with extensive groundwater pumping. In drought years, more than 80 percent of irrigation water comes from underground.
After decades of pumping, underground water resources are dwindling. Wells in the Tulare Basin now must be drilled as much as 3,500 feet (more than 1,000 meters) deep to find adequate water. There’s no way to measure exactly how much water remains underground, but managers need to make the wisest use of whatever there is. That involves monitoring whether water is being drawn from aquifers or from loose soil, known as the water table. In this large region with tens of thousands of unmetered wells, the only practical way to do that is by using satellite data.
A research team from NASA’s Jet Propulsion Laboratory in Southern California and the U.S. Department of Energy’s Lawrence Berkeley Laboratory in Northern California set out to create a method that would do exactly that. They attacked the problem by combining data on water loss from U.S.-European Gravity Recovery and Climate Experiment (GRACE) and GRACE Follow-On satellites with data on ground-level changes from an ESA (European Space Agency) Sentinel-1 satellite. Ground-level changes in this region often are related to water loss, because when ground is drained of water, it eventually slumps together and sinks into the spaces where water used to be—a process called subsidence.
The Tulare Basin is subsiding drastically: The current rate is about one foot (0.3 meters) of sinkage per year. But from one month to the next, the ground may drop, rise or stay the same. What’s more, these changes don’t always line up with expected causes. For example, after a heavy rainfall, the water table rises. It seems obvious that this would cause the ground level to rise, too, but it sometimes sinks instead.
The researchers thought these mysterious short-term variations might hold the key to determining the sources of pumped water. “The main question was, how do we interpret the change that’s happening on these shorter time scales: Is it just a blip, or is it important?” said Kyra Kim, a postdoctoral fellow at JPL and coauthor of the paper, which appeared in Scientific Reports.
