
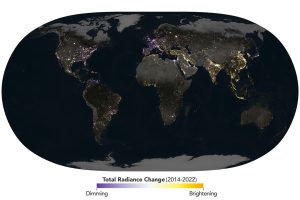
 Maps can show more than just where things are—they can also show how things change. New maps of artificial light reveal a planet that has been reshaping its nights through patterns of brightening and dimming.
The maps are based on a recent analysis of NASA’s Black Marble data, which found that instead of a gradual increase in artificial light at night over the course of nearly a decade, the patterns are much more nuanced. The analysis portrays a world flickering with industrial booms and busts, construction and blackouts as well as more gradual shifts, such as policy-driven retrofits.
NASA’s Black Marble product uses observations from the VIIRS (Visible Infrared Imaging Radiometer Suite) sensors on the Suomi-NPP, NOAA-20 and NOAA-21 satellites to produce records of nighttime lights at daily, monthly and yearly time scales. The VIIRS day-night band detects nighttime light in a range of wavelengths from green to near-infrared and uses filtering techniques to observe signals such as city lights, reflected moonlight and auroras.
The map shows changes in brightness across most of the inhabited world (between 60 degrees south and 70 degrees north). Yellow and gold areas are where there has been more brightening during the study period, from 2014 to 2022, and purple areas are where there has been more dimming.
Image Credit: NASA Earth Observatory images by Michala Garrison, using data from Li, T., et al. (2026).
