 For thousands of years, humanity has sought to improve its ability to make decisions. Record keeping and information gathering has driven many of the innovations. Better information leads to competitive advantage on the battlefield and in the boardroom. But today, we have a truly 21st century problem: too much information. Or rather, too much data, and not enough information.
This deluge of data has led to what is often referred to as the Big Data problem. Although used somewhat casually, this term does have a specific meaning and refers to single datasets that are in the gigabyte or petabyte range. There are several big challenges associated with the Big Data problem; how to manage datasets of this size, how to analyze and visualize to action data into information. With the challenges also come opportunities: the Department of Defense alone is investing $250M annually into Big Data research projects.
Much of this information is georeferenced; indeed, a recent estimate by Dan Sui at Ohio State placed the growth of georeferenced data at an exabyte per day globally. Geospatial data is a big part of the Big Data problem. Yet, perhaps ironically, it stands to play a major role as a tool in the suite that comprises the solution.
Traditional Approaches Support Geoanalysis and Geovisualization
A significant proportion of the exabyte of newly georeferenced data per day is generated by sensor platforms. Sensors are driving advances in a variety of fields. Utilities are using smart meters and intelligent devices to measure the state of their networks in real-time. Traffic sensors measure traffic flow patterns and rates. Billions of cellphones have cameras and GPS embedded, both serving as new sources of sensor data – driving the explosion in Location Based Services that we are witnessing today.
Because this data is georeferenced, it stands to reason that traditional GIS-based tools can facilitate analysis and visualization, to help make sense of the vast volumes of data that these sensors are delivering. The investment in business intelligence tools is staggering, and for the first time, geospatial tools are being found placed within the Gartner Magic Quadrant for BI tools – geospatial tools have been conspicuously absent from the Gartner analysis until now. Many organizations are looking to leverage GIS in conjunction with their BI tools in order to visualize BI results, to glean patterns not possible to be gleaned purely analytically.
Of course, the tried and true tool for this is the desktop GIS. This presents a new era of opportunity for the GIS Analyst, who has in recent years been increasingly relegated to data maintenance or to making maps. Today there is a dawning appreciation of the assumptions that drive spatial analysis, and how those assumptions affect results. Questions such as what map projection is selected – does it preserve distance, direction or area? Considerations of factors such as the modifiable areal unit problem, or spatial autocorrelation.
The biggest challenge to using GIS tools to analyze true Big Data is the volume of data itself. GIS is typically built upon the foundation of a relational database management system, which is optimized typically for datasets of less than a gigabyte and tuned for transactional updates made frequently. While the use of standalone desktop GIS has provided a solid theoretical foundation for analysis and visualization, a number of companies in industry and research groups in academia are exploring different methods for managing this data and interacting with it more efficiently.
IBM Netezza and Esri: A Strategic Alliance for Location Intelligence
Esri has long been recognized as a leader in geographic information. First established in 1969, its roots were as an analytical platform. Esri reached a strategic alliance in 2011 with Netezza, an IBM company, to geoenable the Netezza platform using Esri software and data – enabling the fusion of business intelligence and location intelligence in a seamless platform through Netezza.
 Traditional desktop GIS supports visualization and analysis for smaller datasets. Through Netezza Spatial, Esri software can also consume Netezza layers for Big Data datasets.
The IBM Netezza platform is an Asymmetric Massively Parallel Processing architecture, allowing for standard queries – whether spatial or aspatial – to be filtered and parallelized. Whereas traditional architectures require that data is moved from data storage to the processor – a daunting task for gigabytes or petabytes of data – the Netezza architecture allows the data to be queried in place, with filtering applied first to limit the volume of data that must be processed.
Netezza also provides an analytics toolkit for traditional BI questions, with the result being that both business intelligence and location intelligence questions are integrated and processed in situ. In some ways, this is the next generation of the traditional GIS analysis – most likely queries and models will still be authored on smaller sample datasets using desktop GIS (since Esri has designed the spatial analysis algorithms), but then deployed to the Netezza appliance for application on Big Data datasets. Netezza Spatial Layers can be loaded directly into ArcGIS Desktop, or defined via query layers using Netezza Spatial SQL.
Questions that have been difficult to answer, incorporating a wide variety of variables from spatial and topological relationships such as proximity or shortest distance along a network to financial and demographic factors, or considering are now possible using integrated BI and LI with Netezza and Esri.
Situational Intelligence with Space-Time Insight
The Space-Time Insight (STI) technology has been in the market for a few years now, but has been gaining in market share and mind share. As might be gleaned from the name, STI excels particularly in multi-scale and multi-temporal visualization, representation and analysis of spatially referenced data. STI integrates well with traditional business intelligence tools and dashboards, and can be leveraged as the geospatial component of an analytics platform, but situational intelligence provides much more: the melding of business intelligence, environmental intelligence, machine intelligence, operational intelligence and social intelligence as well as location intelligence to facilitate real-time decision support.
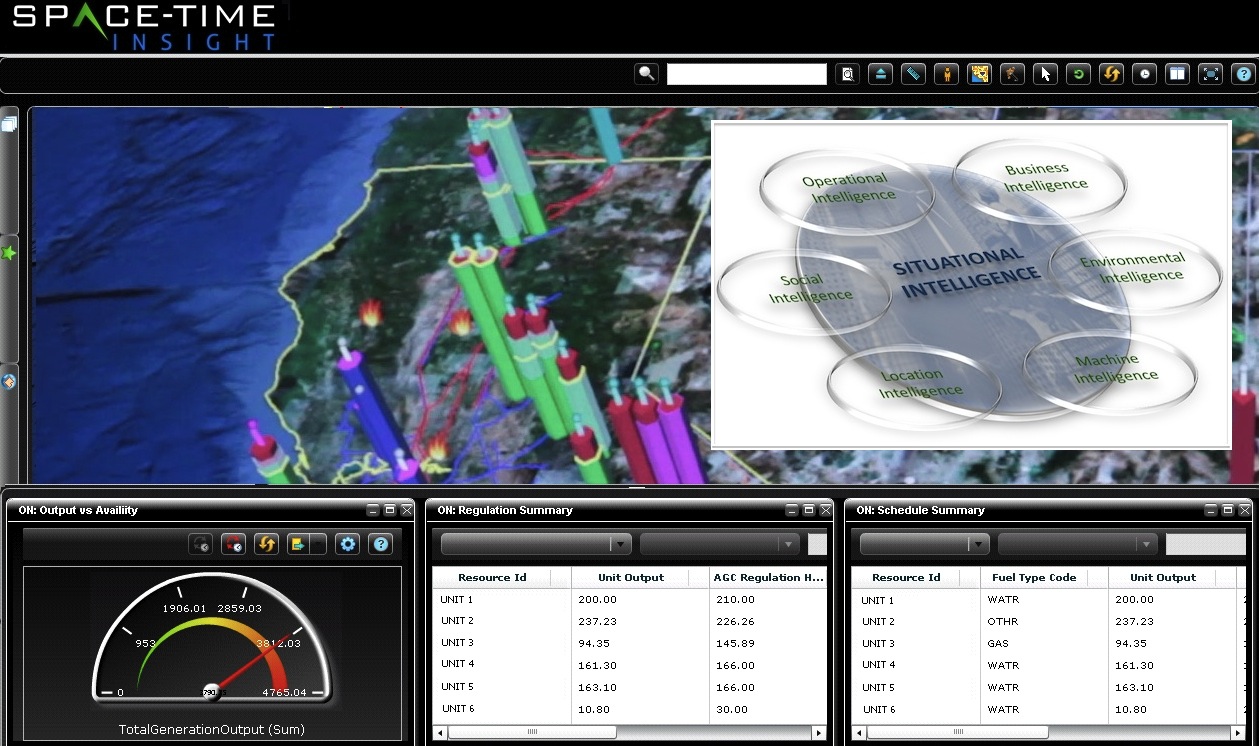 Space-Time Insight provides situational intelligence to integrate a wide variety of contexts into a real-time system.
One of the challenges with Big Data is the ability to visualize patterns from the local-scale to the global scale. STI allows the mapping of analytical results to a geospatial background, and to view those results at the macro scale to observe patterns. Patterns of interest that emerge when viewed at the macro scale can then be drilled down into in order to visualize that same pattern at the micro scale. Results can also be animated in order to view their evolution in time. Traditional hardware can bog down when performing such analysis and visualization on Big Data datasets, so to manage the load and high-volume, STI has recently integrated with Big Data systems SAP HANA and EMC Greenplum.
The other key strength that STI offers is the ability to integrate from multiple data sources, including traditional BI, as well as baseline data that value adds insight into the analysis and visualization process. For example, an electric utility might be interested not only in asset history and lifecycle, but also in incorporating weather, or even market drivers for utility generation. STI sits on the fence between geospatial tools and traditional BI and integration tools, and brings a novel solution to the problem of visualizing analysis results in the context of the larger world. Bringing together backdrop data and real-time data from a variety of sources, STI brings not just analysis but situational intelligence to facilitate decision-making based on real-time inputs.
Ambient Spatial Intelligence Divides and Conquers
The Ambient Spatial Intelligence group at the University of Melbourne, Australia, has taken a novel approach to tackling the volume of sensor-based data. Ambient Intelligence is a sub-discipline of Artificial Intelligence, in which sensing machines respond to variety of inputs and adapt the environment for the comfort and safety of their human counterparts. Examples of this are turning on the lights when someone enters the room, or responding to a voice command to raise or lower the thermostat. Ambient Intelligence relies on a host of new interaction methods including voice, heat, pressure, and decentralized intelligence that is able to respond to these interaction methods to complete the desired activity.
 Decentralized spatial computing, such as in wireless sensor networks, has no central controller – but in GIS and computational geometry algorithms such as this plane sweep, each node performs its own computation.
Ambient Spatial Intelligence adopts this approach and extends it with specific applications for georeferenced and geolocated data. As with traditional spatial analysis, the treatment of spatial data requires care be taken with the underlying assumptions of the structure of the data. However, Ambient Spatial Intelligence leverages the distributed network to perform distributed and parallelized geocomputation.
Unlike traditional GIS, which aggregates all data together in a central location before performing analysis, and which has full availability to the dataset, Ambient Spatial Intelligence (AmSI) nodes do not have full knowledge of the data and perform analysis based on only limited neighborhood knowledge. An example is determining which of the nodes are boundary nodes of a particular condition. Each node can survey the nodes surrounding it to determine if all nodes around it have measurements regarding the particular condition. Nodes for which not all surrounding nodes have measurements regarding the particular condition may then determine whether or not they themselves are boundary nodes for the condition.
The principle value in such an approach is that one of the chief difficulties with Big Data is the ability to reference and analyze all of the data in the dataset, as well as to collect all of the data into a central location. Size alone makes such a proposition difficult; referencing a gigabyte or a petabyte of data measurements at one time will tax even the most robust platform. AmSI gets around this challenge by requiring only a limited subset of data – in particular, only knowledge of the nearest neighbors is required for each node. Each node contains its own computing core and set of algorithms and is able to pre-process the computation first, then combining together the computations to form the result set. It’s a different approach, but one that has merit within the constraints of Big Data.
Driving the Solution
There are a number of approaches to drive to the solution of the Big Data problem currently in development that leverage geospatial tools in ways ranging from business as usual, to innovative, novel, and revolutionary. If anything is clear, it is that the eventual solution will use components from each of these different approaches, but more importantly, it is that geospatial technology – while a major contributor to the Big Data problem – is also a key part of the solution. Our lives take place in the context of time and space. Actions happen in the context of time and space. Shouldn’t then decisions happen in the context of time and space as well?
Acknowledgements: I would like to recognize the contributions of and thank Julio Olimpio, IBM Strategic Alliance Manager at Esri, Steve Ehrlich, SVP of Marketing at Space-Time Insight, http://www.spacetimeinsight.com, and Dr. Matt Duckham, Associate Professor at the University of Melbourne Department of Infrastructure Engineering, http://ambientspatial.net.
