
 From Jan. 19-22, 2026, a particularly strong X-class solar flare caused a geomagnetic storm in Earth’s atmosphere, with some of the most intense radiation storms on record. The cause was an eruption on the Sun’s surface, which released high-energy particles that reached Earth within 25 hours. ESA’s ice mission, CryoSat, had just received an important software update, enabling the mission to not only monitor polar ice sheets and sea ice, but also provide scientific data on Earth’s magnetic field.
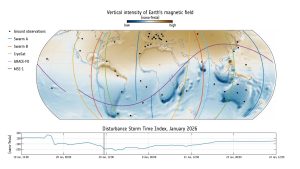
As shown in this image, data from CryoSat, together with data from two of Swarm’s satellites, as well as data from the Macau Science Satellite-1 (MMS-1) and NASA’s GRACE-FO satellite, were used to model the intensity of the disturbance in Earth’s magnetic field caused by the solar flare. The colors on the map represent intensity extremes, with the dark orange indicating where Earth’s magnetic field increased in strength, while the dark blue indicates where the magnetic field got weaker. The magnetic intensity highs and lows over the three-day period illustrates the disturbance in Earth’s magnetosphere.
The Disturbance Storm Time (DST) index, shown below the map, indicates the severity of geomagnetic storms, measured in nano-Tesla (nT). The more negative the DST value, the stronger the storm, suggesting that the storm was at its most powerful just after mid-day on Jan. 20, 2026.
Image Credit: ESA (Data source: A. Grayver/University of Cologne, and N. Olsen/DTU)
