 The sciences, technologies, and practices of remote sensing and of geographic information systems (GIS) arose separately, developed in parallel, intersected, and are now inextricably linked. Nearly all the features in most GIS are collected by means of satellite imagery or aerial photogrammetry, and GIS is the application where this imagery is most commonly visualized. “All the foundation elements of GIS come from remote sensing: cultural features, roads, buildings, water features, topography, terrain, soils, slopes, geology, and many more,” points out Lawrie Jordan, Director of Imagery at Esri.
It was not always this way. In the 1970s, 1980s, and early 1990s, remote sensing and image processing, on the one hand, and GIS on the other, were separate worlds—each with its own culture and software. The former stored data in a raster format and used multispectral classification; the latter stored data in a vector format and used topology. Software vendors specialized in one or the other—even though their customers were acquiring and using both types of data. Until recently, in a GIS context, imagery was thought of only as a background or a base map to the information that was being analyzed.
Over the last decade, however, remote sensing and GIS have become increasingly integrated. “Now people are seeing imagery as a source of a lot of GIS information,” says Jennifer Stefanacci, Director of Product Management at Exelis. “So, the analysis workflows that our users are doing incorporate both analysis of the imagery and analysis of their GIS data.” While GIS gives you the information about ‘where,’ through information extraction routines, remote sensing gives you the information about ‘what,’ explains Mladen Stojic, V.P. of Geospatial at Intergraph, “By merging the two, we now have the opportunity to do modeling with raster data, vector data, and, on top of that, terrain data.”
Today, GIS is the most practical and efficient platform to combine remote sensing with other layers of information. “People do not acquire and process imagery just to make a pretty picture out of it,” says Jordan. “They want to combine it with other spatial information to solve problems and create meaningful results.”

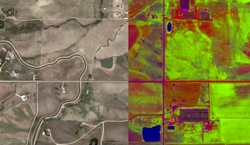
Using image analysis algorithms to analyze and map wetness and vegetation vigor in imagery. Image courtesy of Esri.
In the traditional linear image processing workflow, which has been standard for more than 30 years, a technician classifies, rectifies, and mosaics each image, creating many intermediate files. This process is very labor-intensive and requires a lot of storage space. By contrast, the new technology processes the imagery within the framework of a GIS in near real-time on demand, Jordan points out. “The architecture for doing this uses a very intelligent geodatabase structure called a mosaic dataset, so you can define the process chain that happens to the image dynamically and pull the image through it. You can do orthorectification, color balancing, pan sharpening, and mosaicing, on datasets of virtually unlimited sizes, all dynamically, on the fly. This is truly a game changer.”
Exelis has been working with Esri for about four years on developing workflows that allow users to use the two companies’ products in a combined fashion. “We realize that users have access to a variety of data and the better they can leverage all of their data, the better decisions they can make,” says Stefanacci. “So, we’ve built workflows that allow users to move smoothly between ENVI and ArcGIS and make it easy to do their analyses without having to think about using many different software products.”
For example, to find out the area of rooftops in a sub-division, a land assessor can use Fx from the ENVI Toolbox in ArcMap to identify the rooftops in his image, then output to a shapefile and use ArcMap spatial analysis tools to analyze which rooftop areas have changed since the last assessment. In another scenario, a city planner asks his GIS specialist which parks in their city have been added in the last four years. Unfortunately, the records have not been kept and this information is not readily available; however the city does have imagery available. Since the timeframe is too short for the GIS specialist to visit each park to update her maps, she uses imagery to identify all of the park land. She performs a “classification without training data” from the ENVI toolbox on the earlier image and a current one, and then runs a change detection to determine which of the park areas have changed. Finally, she uses this data to update the city’s GIS database.
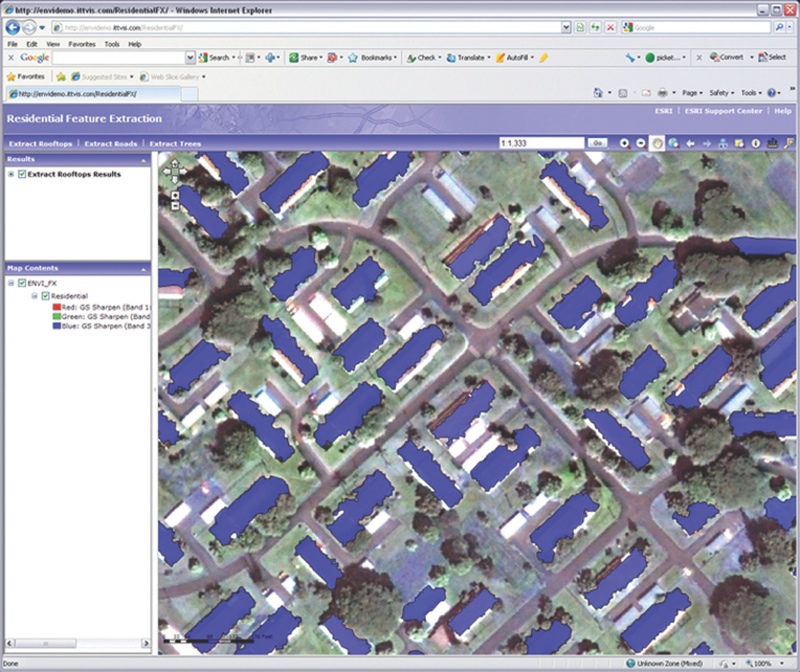
The ENVI Feature Extraction Module (ENVI FX) from Exelis provides tools to read, explore, prepare, analyze, and share information extracted from all types of imagery, such as the rooftops in the image above. Image courtesy of Exelis.
LiDAR data files present special challenges because they are huge. To use them in Esri products, users must first chop them up, says Stojic. “So, it’s hard for people to find and effectively manage the raw data, which is most valuable.” Intergraph’s 2013 release, he says, solves that problem, in three ways. First, it enables users who cannot afford a LiDAR sensor to create very accurate and dense point cloud datasets from stereo imagery. Second, it enables them to harvest the metadata and then use it to catalog, manage, find, and download the data they need. Third, it allows them to natively support the data from a visualization and an exploitation perspective, “meaning that you can take an LAS file and not have to convert it into a different dataset and create redundant data on disk, in order to use it.”
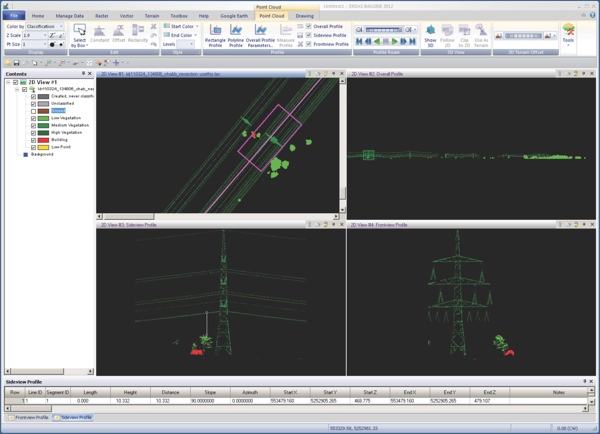
Classified LiDAR dataset of a power line corridor with the ground class turned off, used to measure encroaching vegetation. The planimetric view and three profile views are visible. Image courtesy of Intergraph.
The variety and amount of remotely sensed data available to users has increased dramatically in recent years—and will continue to increase, as LiDAR sensors come down in price, new satellites are launched, and UAVs become ubiquitous. Organizations often have LiDAR, SAR, multispectral, hyper-spectral, and panchromatic data—each of which has its unique benefits—and can now analyze them using a single package and integrate them seamlessly into GIS. According to Jordan, imagery is fully integrated throughout all the ArcGIS products—desktop, server, mobile, and in the cloud—and they are very rapidly improving their capability to support imagery.
“By bringing together Intergraph and Leica Geosystems, Hexagon has specifically targeted the integration of surveying, photogrammetry, cartography, GIS, and remote sensing, so that the ‘smart map,’ as we like to call it, really becomes the point of convergence,” says Stojic. “We hope to break down the historical silos that have been built up because of proprietary, closed systems.” Intergraph’s 2013 release, he claims, fulfills this “dream and vision.”
In geospatial technologies, as in many other fields, the trend is to move beyond traditional file-based architectures toward cloud-based services. At the same time, there is increasingly a need for easy access to large volumes of imagery and analysis tools. “This has resulted in demand for online dynamic services rather than just static capabilities,” says Jordan. “These are being offered as cloud-based services through a new business model which is based on subscriptions and credits. The latest version of ArcGIS Online contains a significant amount of global high-resolution imagery and this will soon be accompanied by a new series of premium services.” The move toward cloud-based solutions will also further accelerate the fusion of geospatial technologies and data layers.
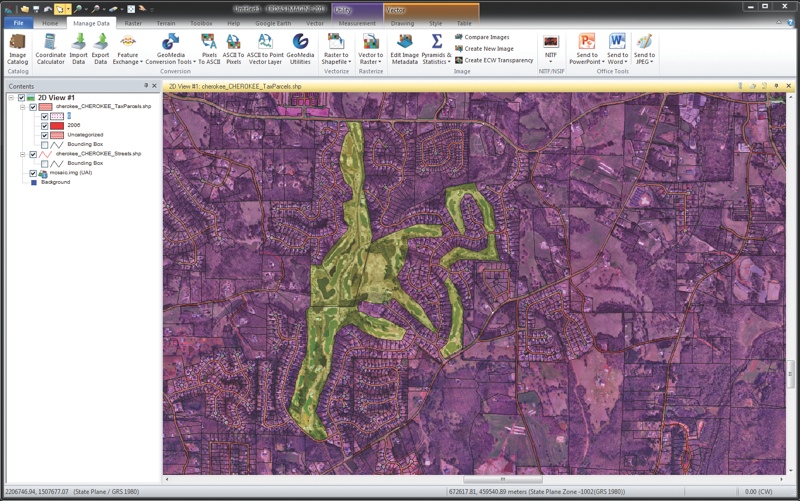
The 2013 release of ERDAS IMAGINE provides greater raster and vector integration. Image courtesy of Intergraph.
Ten years ago, few software programs were capable of generating 3D visualizations. Now, thanks in part to Google Earth and Bing Maps, 3D has become commoditized and expected. “We introduced our first 3D product in 1996,” Stojic recalls. “Since then, graphics cards have become more powerful and more 3D-aware and their price point has dramatically decreased, driving up adoption. You now have a culture that is 3D-aware. Most people won’t even look at your product if you don’t do 3D right out of the box.”
To enhance its 3D capabilities, Esri recently acquired Procedural, the maker of a product called City Engine, designed to create 3D cities. “The future trend for feature extraction is really about extracting 3D environments,” says Jordan. “Esri recently acquired a very large collection of current, high-resolution DigitalGlobe imagery for the entire planet and I believe that’s going to drive a lot of these new 3D visualizations.” While Esri is working on visualizing 3D point clouds, Exelis’ tools focus on extracting information out of the point cloud and turning it into data that users can incorporate into their GIS databases, says Stefanacci.
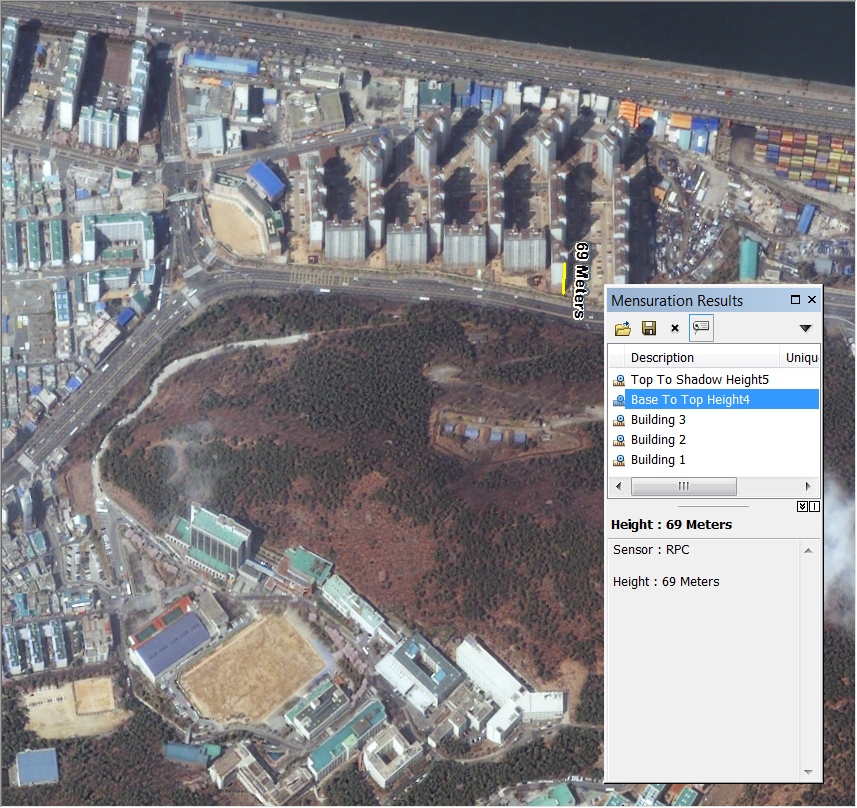
Measuring the height of features in satellite imagery. Image courtesy of Esri.
The Holy Grail at the intersection of remote sensing and GIS is rapid, efficient, and accurate automated feature extraction. It is an iterative process in which a specialist repeatedly tweaks different parameters to create templates, which are then used by others to update or extract features.
In its 2013 release, Intergraph has introduced a new modeling environment that expedites this process, says Stojic. “You will start to see more of our feature extraction and change detection tools migrate over into this dynamic modeling environment so that we shorten that lifecycle and streamline the process required to get the best information layer out of this automated change detection technology.”
Exelis also has a strong tradition in this area. Its ENVI LiDAR product has automated methods to extract buildings, trees, powerlines, and power poles directly from the 3D point cloud, says Stefanacci. “We are looking at adding additional feature types in our upcoming releases.”
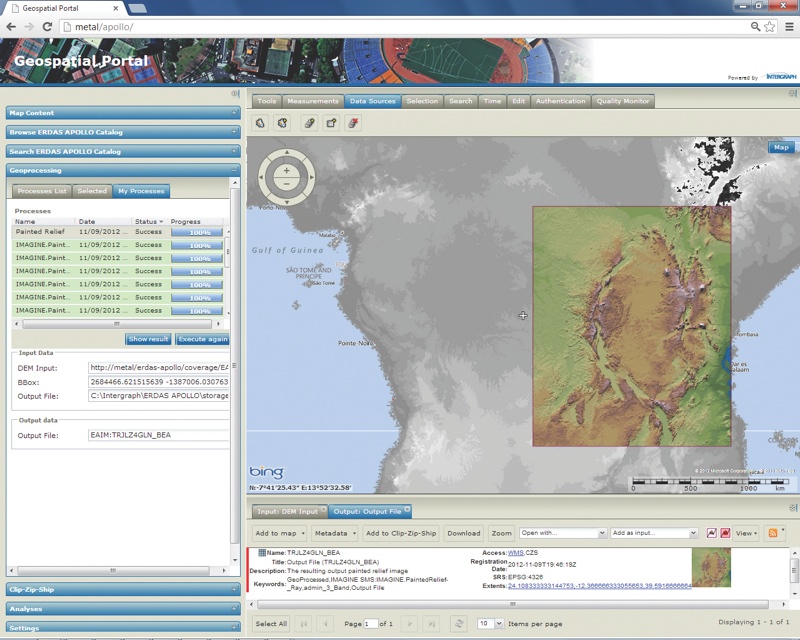
In conjunction with the Geospatial Portal, ERDAS APOLLO offers on-the-fly geoprocessing that enables users to execute spatial models from a Web client. Image courtesy of Intergraph.
The amount of data collected by UAVs and microsatellites is about to explode. “It’s the digital fire hose in the sky and the best thing that’s ever happened for remote sensing,” says Jordan. “Clients around the world, such as major oil companies and defense and intelligence organizations, are using ArcGIS to handle tens of millions of high resolution images dynamically. ArcGIS is highly scalable and was designed that way from the beginning in anticipation of this essentially global, persistent surveillance. I believe that, very soon, we are going to be mapping, measuring, and monitoring every square meter of the surface of the Earth in near real-time. There will be several hundred orbiting, on-station imaging satellites.”
Hexagon is also playing in that space. For example, two years ago it released software to extract features from motion video. “We are looking at geo-referencing software and the development of the aerial triangulation required to stitch together multiple frames over time in order to get a highly accurate data product out of that data source,” says Stojic.
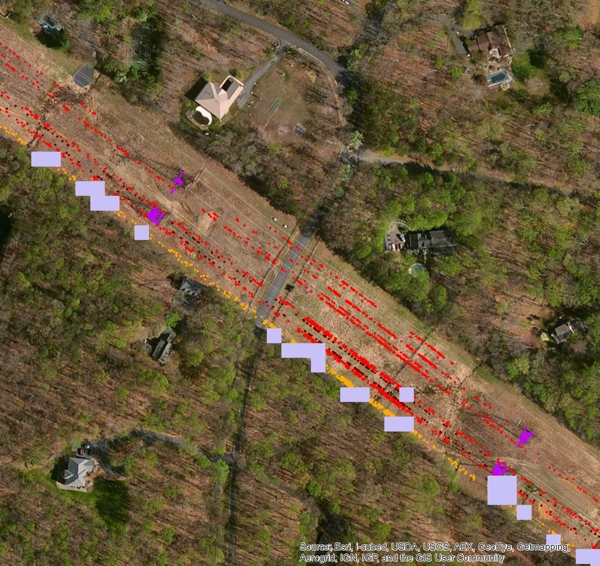
Analyzing airborne LiDAR to identify work order areas for inspection along utility corridors. Image courtesy of Esri.
What brought remote sensing and GIS together? “The point of convergence,” says Stojic, “has been the modernization of the map—by which I mean Google Maps, Bing Maps, location-aware maps. That’s where we’ve seen the two philosophies come together to form one approach to mapping. That’s not because of Esri or Intergraph, but because companies like Google and Microsoft have introduced a new philosophy about the map and the layers of information inside it. Other professional vendors are continuing to support that fusion through the synthesis of raster, vector, and point cloud data in modeling applications, in workflows, and so forth.”
How are these developments in remote sensing and GIS going to affect the end product for most consumers of geospatial information—the map? “The map of the future is not really a map at all, but rather an intelligent 3D image,” says Jordan. “It is going to be photo-realistic, and you will be able to fly through it, navigate, interrogate, analyze, visualize, and then collaborate and share it with others. It will all be cloud-based and imagery is going to drive that. What I see happening is something I like to think of as the ‘living planet’—global persistent surveillance, where all of these sources are made available dynamically. GIS is the ideal environment to bring all this together. It’s the most exciting time in the more than 40 years that I’ve been involved with this.”
The integration of remote sensing and GIS is at the center of a larger trend toward the fusion of different kinds of geospatial data and technologies that also include video, sensor networks, and GPS-based tracking of mobile assets. At each step in this integration, the new capabilities progress rapidly from advanced feature to standard practice. For scientific, governmental, commercial, and consumer applications, the line between reality and virtual reality is blurring.