 Supply chains include both upstream and downstream relationships involving goods, services and customers. The delivery of geographic information (GIS) will necessarily include each of these. The Supply-Chain Operation Reference (SCOR) Model can be used to interpret and understand geospatial supply chains. The mapping of the various processes will assist a GIS unit to understand the processes involved as well as providing a tool to measure the production.
Introduction
This article is a response to the article: Do Surveying – GIS Workflows Really Exist? by Jeff Thusrton (Vol 5/Issue 42/ Oct. 18, 2011). Thurston’s concerns echoes those from Dangermond (1999) and Tomlinson (2000) who both provided a view on the future of Geographic Information Systems (GIS) in the 21st century.
The society will become more spatially enabled, meaning that geography and GIS will become and in some instances already embedded in mainstream decision-making and incorporated into enterprise systems such as Oracle and SAP and as demonstrated in Oracle (Dangermond, 1999; Tomlinson, 2000; and Mann as interviewed by GEO World, 2004).
One of the challenges according to Dangermond (1999) and Tomlinson (2000) for GIS units in the 21st century is to be able to manage themselves successfully in order to deliver the right product at the right time to the right customer (Pulsani, interviewed by GEO World (2004)). Tomlinson (2000) also indicated that there will be several management tools available to assist GIS units to enable them to manage themselves successfully. One of these tools to address the management issue is supply chain management as used in industry.
Any product such as a cadastre for town planning, a road data set for routing vehicles or a 3D image of a specific area generated by using a GIS, be it for internal or external use, has a supplier or suppliers of data and materials, the GIS unit that produced the specific product and has a customer or customers that receives the product at the other end of the chain. Materials in this context are CD-ROMs, flash sticks, printer inks and paper, etc. that are required to deliver the final product.
This, according to Mentzer, et al (2001) is a basic supply chain. In some instances money may flow up the supply chain from the customer to the supplier. In all instances information flows up and down this supply chain (Roberts, 2003). This article will briefly describe what a supply chain is; how it can be modelled and how it be applied to manage projects in a GIS unit.
Supply chains and supply chain management
As mentioned before, a basic supply chain consists of suppliers, a production unit and customers. A supply chain is defined as follows:
“The supply chain encompasses all activities associated with the flow and transformation of goods from the raw materials stage (extraction), through to the end user, as well as the associated information flows. Material and information flow both up and down the supply chain (Handfield and Nichols, 1999:2).”
Supply chain management is defined as follows:
“The management of upstream and downstream relationships with suppliers and customers to deliver superior customer value at less cost to the supply chain as a whole (Christopher, 1998:18).”
The above definitions are a quite a handful and the challenge is how these supply chains can be made visible to a GIS in order to manage them properly. An intuitive model is available, namely the Supply-Chain Operation Reference (SCOR) Model from the Supply-Chain Council. Introductory materials are available on the Internet (http://supply-chain.org/f/SCOR-Overview-Web.pdf). The SCOR model consists of five management processes that describe the supply chain. These management processes are PLAN, SOURCE, MAKE, DELIVER and RETURN (Supply-Chain Council, 2010).
PLAN deals with planning of the supply chain and aligning it with the financial goals of the organisation. SOURCE looks at the processes involved to obtain products from suppliers. In this context it is data and materials. MAKE deals with the actual production of the GIS product.
A GIS product is a spatial data set generated to fulfil a specific requirement set by a customer. DELIVER looks at the delivery of the final GIS product to the customer or customer. RETURN deals with faulty data in the context of GIS. The GIS unit can receive faulty data from a supplier or the GIS unit by accident delivered faulty data to a customer (Schmitz, 2007).
The SCOR model looks at three product types, namely Make-to-Stock, Make-to-Order and Engineer-to-Order and is behaviour driven (Supply-Chain Council, 2010). An example of Make-to-Stock product is a road data set created by a GIS unit for sale to any customer that is interested in a road data set. You place an order, pay for it and take the data home. The GIS unit just makes a copy of the data set and gives it you. Make-to-Order product is a product that the GIS unit will make only if an order is received. It involves standard operating procedures and has in most instances a well defined workflow. An example is the delivery of a geo-rectified satellite image.
The GIS or remote sensing unit will have the raw satellite image in storage, but will only geo-rectify the image once an order is received. Engineer-to-Order products are those products that a GIS unit creates from scratch for a customer and are unique and once off. Maintenance of spatial data can be seen as special form of Make-to-Stock or Make-to-Order depending on nature of the maintenance.
An example would be the maintenance of the road data set, since new developments occur that creates new roads or changes existing road infrastructure and these needs to be incorporated into the existing road data sets. The maintenance cycle is determined by how quickly the entity changes (Schmitz, 2007).
The SCOR model works on three levels namely the strategic level (Level 1) and determines how well the GIS unit performs with regards to delivery of the product to a customer, how well the GIS unit utilises its assets, the cost of producing the products and operating the supply chain.
These measurements will also enable the GIS unit to measure itself against its competition if the competition’s general data is available from its annual reports. Level 2 of the SCOR model is used to configure the supply chain based using one of the production types discussed above. Level 3 of the SCOR model breaks each process category identified in Level 2 into process elements, which are the elements that are required to make the supply chain work. Level 4 is outside the SCOR model scope and are the implementation steps required to make each process element work (Supply-Chain Council, 2010). The next section gives an example of how supply chain management in conjunction with SCOR model can be used in the production of road data set that can be used for routing vehicles.
Using supply chain management in GIS
This section gives an example on the use of supply chain management in GIS. We start with a very high level overview of the process as shown in Figure 1. The road data set is a Make-to-Stock product with a specific life cycle before it will be replaced by an updated road data set. In our example the road data set will be made from scratch.
The GIS unit that will produce the road data set will source spatial data from various suppliers such as road departments from local authorities, provincial and national bodies and form its own database. The GIS unit will then produce the road data set and after final quality control the road data set together with its metadata will be released to its customers. Customers may be internal and external.
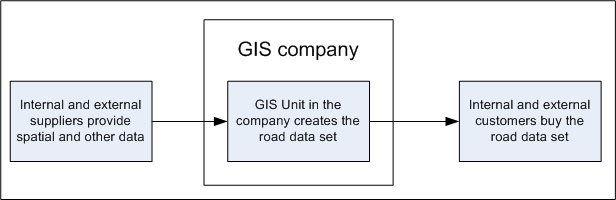 Figure 1: High level GIS supply chain
The next step is to configure the supply chain using the five management processes and its related Level 2 Process Categories as given in the overview document. The interesting asset of the SCOR model is that you can choose the various processes that are suitable for the GIS unit and ignore the rest as illustrated in Figure 4. It is like choosing the appropriate LEGO blocks to build a house. Figure 2 illustrates the configured supply chain.
In this example the GIS unit has three external suppliers of road data and one internal supplier (see Figure 2). The internal supplier is the GIS unit itself where it created its own road data set that was not covered by the other suppliers. The GIS unit sourced satellite imagery and aerial photographs to create the road data set.
Once the GIS unit completed it, it released the data for incorporation into the larger road data set. Once all the sourced data from suppliers are available the GIS unit produces the road data set (M1: Make to Stock). D1: Deliver Stocked (Make-to-Stock) Product deals with the delivery of the road data set to the various customers.
Once the process has been mapped, you can measure it with regards how fast the sourcing, production and delivery is, how much each process category costs, how ell the resources are utilised, etc. For illustrative purposes, only two of the process categories given in Figure 2 will be expanded into SCOR Level 3 processes. The process categories are S2: Source Make-to-Order product and M1: Make to Stock. Figure 3 gives the process elements for S2 and Figure 4 for M1.
The mapping process used at this level is a reduced version of IDEF0. This allows for the assigning of responsibilities, best practices, inputs, outputs, enablers and controls. Responsibilities are linked to a position and not a specific individual by name. Inputs are the entities that are being converted into an output or outputs by the process. Enablers are the entities that will make it happen and controls are entities that control the process to ensure that the process complies with specific regulations and standards. No listed entities under Control or Enabler in Figure 3, means that none has been identified.
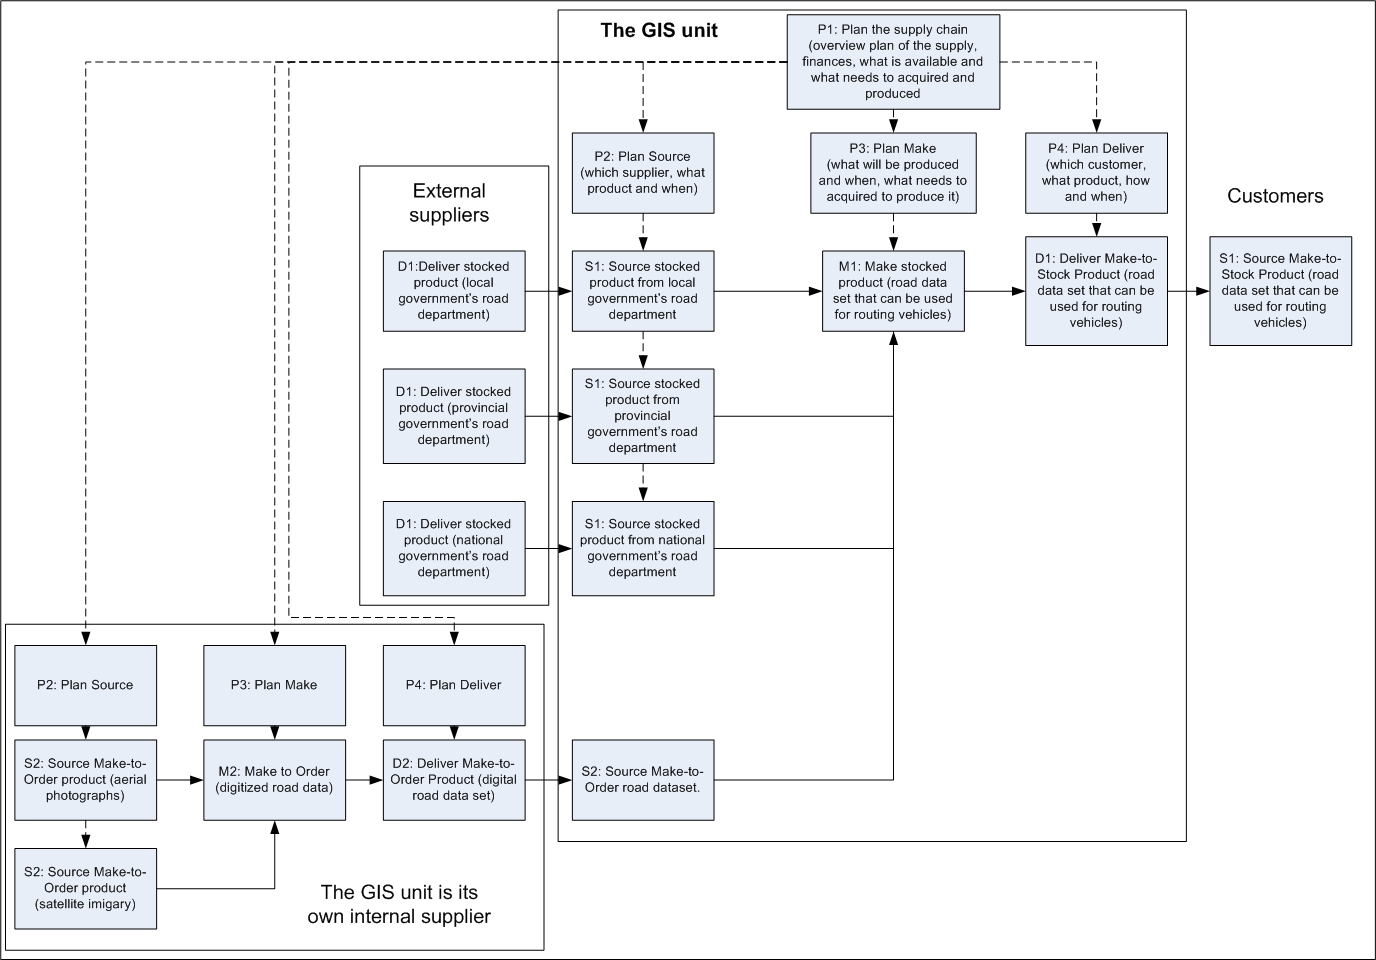 Figure 2: The production of the road data set at SCOR Level 2 Process Categories.
![]()
Figure 4 gives the process elements with regards to the production of the road data set. The Reader will notice that two processes are excluded from this example namely M1.4: Package and M1.7: Waste Disposal. M1.4: Package deals with the packaging of a product before it is placed in a warehouse. With regards to spatial data, it is placed into a geodatabasse or data warehouse, from which a CD-ROM is cut when required. This will be part of the delivery process and not of the production process. M1.7: Waste Disposal looks at the responsible disposal of waste generated during the production process, which is not applicable in the production of a spatial data set.
 Figure 3: SCOR Level 3 process elements for S2: Source Make-to-Order road data set.
 Figure 4: The production process.
Conclusion
The mapping of the various processes will assist a GIS unit to understand the processes involved as well as providing a tool to measure the production. The measurement results can identify problems within the production process. If the overall supply chain cycle time is too long, i.e. from the start of the project to end of the project when the data is released for distribution, the process can then be used to determine where the problem lies.
The problem could be that the supplier did not deliver the data at the promised date; the data was of insufficient quality and the supplier needed to clean it; the GIS specialist working on the data did not had the right skills to work the data to name a few examples. By identifying problems and rectifying them in the supply chain it will enable a GIS unit to save time and money, which will enable the GIS unit to produce more products with existing resources as well as being more competitive and profitable. Supply chain management will further enable a GIS unit to foster good relationships with its supplier and customers that will result in a more competitive supply chain with benefits to all involved.
—————————————————————
Dr Peter Schmitz – Logistics and Quantitative Methods, CSIR Built Environment, PO Box 395, Pretoria 0001, South Africa Email: [email protected]
Acknowledgements
The author would like to thank Jeff Thurston and Matt Ball from Vector1 Media for the opportunity to write this article. Most of the work is based on my PhD research and would like to acknowledge my promotors, Dr Lukas Scheepers and Prof Piet de Wit for promoting and the University of Johannesburg for awarding the PhD.
References
Christopher, M. 1998: Logistics and Supply Chain Management: Strategies for Reducing Cost and Improving Service. 2nd Edition. Financial Times, Prentice Hall, Pearson Education Limited, Harlow, Essex, UK.
Dangermond, J., 1999: The Future Favors GIS. ArcNews Online. Viewed on 7 April 2008. http://www.esri.com/news/arcnews/fall99articles/03-futurefavors.htm 26 July 1999.
GEO World, 2004: Industry Outlook 2005. GEO World, December. Viewed on 15 December 2004. http://www.geoplace.com/uploads/featurearticle/0412io.asp
Handfield, R.B. and Nichols, E.L., 1999: Introduction to Supply Chain Management. Prentice Hall, Upper Saddle River, USA.
Mentzer, J.T., DeWitt, W., Keebler, J.S., Min, S., Nix, N.W., Smith, C.D. and Zacharia, Z.G., 2001: What Is supply chain management? In Mentzer, J.T. (Ed): Supply Chain Management. Sage Publications, Thousand Oaks, USA.
Roberts, L., 2003: Supply Chain Management Certificate Program: Course notes. Course developed and presented by the Georgia Institute of Technology, Atlanta, Georgia and L. Roberts & Associates, Toledo, Ohio, USA.
Schmitz, P.M.U., 2007: The use of supply chains and supply chain management to improve the efficiency and effectiveness of GIS units. Unpublished PhD Thesis, University of Johannesburg, Johannesburg, South Africa.
Supply-Chain Council, 2010: Supply-Chain Operations Reference Model Version 10.0. Supply-Chain Council, Pittsburgh, USA. www.supply-chain.org
Tomlinson, R.F., 2000: An overview: the future of GIS. ArcNews Online, Winter 2000. Viewed on 7 April 2008. http://www.esri.com/news/arcnews/winter9900articles/gis2000/30-tomlinson.html
