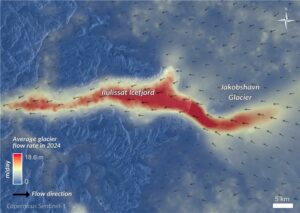
Average daily flow speed of Jakobshavn Glacier in 2024. The glacier moves fastest where it meets the Ilulissat Icefjord (shown in dark red on the map, representing the central section of the glacier located at the contact zone between land and water). (Credit: ESA’s Sentinel-1 satellite data)
Melting glaciers worldwide are significant indicators of climate change, revealing dynamic shifts in Earth’s environment. Satellite technology plays a crucial role in tracking these changes by measuring glacier movement and mass balance to assess climate impacts. Glaciers are dynamic and sensitive geosystems that respond to human-driven climate changes, constantly moving and evolving rather than being static ice blocks. Their behavior reflects the planet’s overall environmental condition.
There are about 200,000 glaciers globally, including large ice sheets in Greenland and Antarctica holding most of Earth’s freshwater. Between 2000 and 2023, glaciers lost an average of 273 billion tonnes of ice annually, contributing to sea-level rise, with even greater loss in 2024. Glacier mass balance becomes negative when ice melt exceeds snowfall accumulation, affecting flow velocity. Changes in glacier speed, either acceleration or deceleration, signal shifts in ice mass and help estimate ice loss entering oceans.
By using offset tracking (i.e., comparing the intensity of satellite images taken on different dates and tracking pixel displacement), Vilnius University, Lithuania, researchers calculated how far a glacier has moved over a day or a year. According to data from the European Space Agency’s (ESA) Sentinel-1 satellite, the average flow speed in different parts of Jakobshavn Glacier in 2024 was approximately 18.6 m per day, noticeably slower than in previous decades. This glacier moves fastest where it meets the Ilulissat Icefjord (shown in dark red on the map, representing the central section of the glacier located at the contact zone between land and water).
