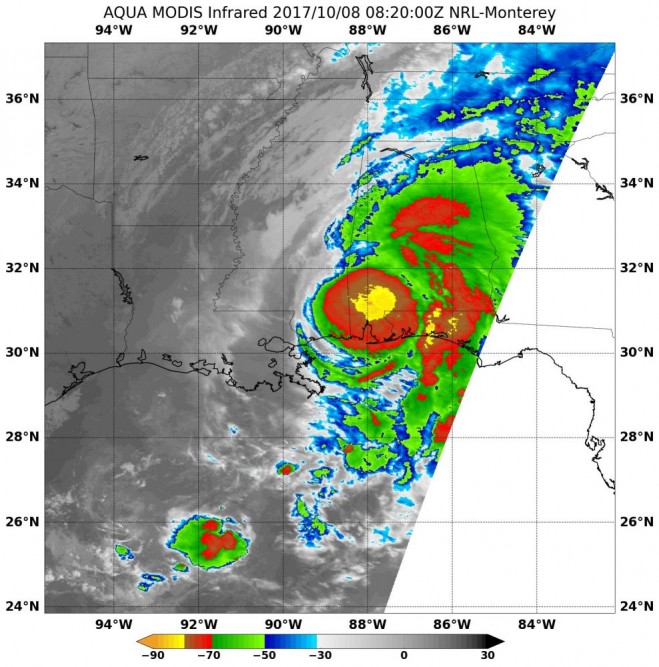
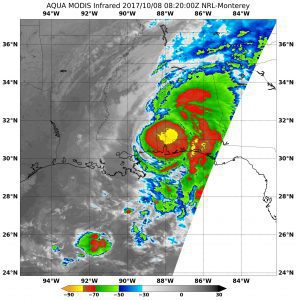
On Oct. 8, 2017, the MODIS instrument aboard NASA’s Aqua satellite analyzed Nate’s cloud-top temperatures in infrared light and found the strongest storms (yellow) around the center of circulation. (Credit: NASA/NRL)
NASA’s Aqua satellite and NASA-NOAA’s Suomi NPP satellite analyzed the temperatures in Hurricane Nate’s cloud tops and determined that the most powerful thunderstorms and heaviest rain areas were around the center of the tropical cyclone after it made landfall near the mouth of the Mississippi River on Oct. 7, 2017.
Infrared light provides valuable temperature data to forecasters, and cloud-top temperatures give clues about the highest, coldest and strongest storms within a hurricane. NASA’s Aqua satellite and NASA-NOAA’s Suomi NPP satellite provided such data and showed that the strongest storms circled Hurricane Nate’s center.