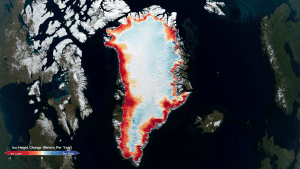
 Using the most advanced Earth-observing laser instrument NASA has ever flown in space, scientists have made precise, detailed measurements of how the elevation of the Greenland and Antarctic ice sheets have changed over 16 years.
The results provide insights into how the polar ice sheets are changing, demonstrating definitively that small gains of ice in East Antarctica are dwarfed by massive losses in West Antarctica. The scientists found the net loss of ice from Antarctica, along with Greenland’s shrinking ice sheet, has been responsible for 0.55 inches (14 millimeters) of sea-level rise between 2003 and 2019—slightly less than a third of the total amount of sea-level rise observed in the world’s oceans.
The findings come from NASA’s Ice, Cloud and land Elevation Satellite 2 (ICESat-2), which launched in 2018 to make detailed global elevation measurements, including over Earth’s frozen regions. By comparing the recent data with measurements taken by the original ICESat from 2003 to 2009, researchers have generated a comprehensive portrait of the complexities of ice sheet change and insights about the future of Greenland and Antarctica.
The study found that Greenland’s ice sheet lost an average of 200 gigatons of ice per year, and Antarctica’s ice sheet lost an average of 118 gigatons of ice per year.
One gigaton of ice is enough to fill 400,000 Olympic-sized swimming pools or cover New York’s Central Park in ice more than 1,000 feet (300 meters) thick, reaching higher than the Chrysler Building.
“If you watch a glacier or ice sheet for a month, or a year, you’re not going to learn much about what the climate is doing to it,” said Ben Smith, a glaciologist at the University of Washington and lead author of the new paper, published online in Science on April 30, 2020. “We now have a 16-year span between ICESat and ICESat-2 and can be much more confident that the changes we’re seeing in the ice have to do with the long-term changes in the climate.”
ICESat-2’s instrument is a laser altimeter, which sends 10,000 pulses of light a second down to Earth’s surface, and times how long it takes to return to the satellite—to within a billionth of a second. The instrument’s pulse rate allows for a dense map of measurement over the ice sheet; its high precision allows scientists to determine how much an ice sheet changes over a year to within an inch.
The researchers took tracks of earlier ICESat measurements and overlaid the tracks of ICESat-2 measurements from 2019, and took data from the tens of millions of sites where the two datasets intersected. That gave them the elevation change, but to get to how much ice has been lost, the researchers developed a new model to convert volume change to mass change. The model calculated densities across the ice sheets to allow the total mass loss to be calculated.
Photo Credit: NASA’s Goddard Space Flight Center
