 Satellite derived ground and structure stability information is increasingly being used by developers and engineers who require a detailed understanding of ground stability issues across the UK. David Mole and Adam Thomas explain how a new satellite technology will offer valuable insight into Britain’s changing landscape at a time when the impact of climate change is making technology more important than ever.
In the UK ground stability has risen up the agenda for consultants specialising in civil engineering and due diligence as climate change prompts changes in weather patterns, and extreme conditions such as flooding and drought take their toll on the environment. There is also an increasing need to understand the land-based consequences of Britain’s industrial legacy, including mining.
Geology and mining information is essential for professionals who undertake ground investigations and also for equipping the insurance market with accurate background information. However, gaining an accurate understanding of ground stability issues is not always easy to capture without employing more advanced and often expensive technologies. As a result there has been a shift in recent times with more and more professionals drawing on satellite technology to gain a greater insight into past and present ground stability.
Landmark Environment specialises in providing mapping data for environmental consultants and surveyors and has recently enhanced one of its existing tools for the industry. The Envirocheck Mining and Ground Stability Report has been updated to include a new type of satellite mapping called motionmap UK, a product developed by satellite mapping specialists Fugro NPA. motionmap UK uses a satellite mapping technique known as Persistent Scatterer InSAR (PSI) to map historical ground and structure motion associated with urban and semi-urban regions across the UK.
The technology has the ability to highlight a wide range of natural and anthropogenic motion phenomena such as those linked to: subsidence, mining and mine water recharge, soil shrink/swell, oil & gas production and carbon storage, groundwater abstraction, flood susceptibility, geological activity and construction activities.
Many of these phenomena are studied using conventional mapping and surveying techniques but these can be expensive, labour intensive and, in some instances, put life at risk. Furthermore, some instability can remain undetected due to unsuitable survey conditions (e.g. thick vegetation, adverse weather conditions) or because motions are so subtle that they are difficult to detect and monitor. At a time when there is more pressure than ever for new industrial development, construction and housing, the need for a cost and time effective method of assessing, monitoring and mitigating ground and structure motions has never been greater.
Additional information relating to the stability of the ground or structures placed upon it can be of significant benefit in the feasibility, planning, construction and monitoring phases of a project and can greatly enhance data obtained from conventional surveying and monitoring methods. Companies assign a high priority to understanding baseline stability prior to construction activities.  Baseline data can be compared to post-construction data and used to increase understanding of impacts of engineering activity, as well as providing a valuable tool in assessing liability during insurance disputes.
There is a growing acceptance in the development sphere that satellite mapping is vital to gaining the level of accuracy required for insurance claims data, particularly in relation to ground stability.
The significance of this last point has taken on increasing significance in the ground engineering industry, particularly as the consequences of climate change take hold. The accurate data that satellite mapping derives is vitally important for consultants working in the insurance market. A recent report from the Association of British Insurers predicted that the impact of climate change is set to make insurance more expensive and harder to obtain, stating that the rises in temperatures in the UK could “significantly” increase the cost to insurers of flood and windstorm damage.
This innovative mapping technology offers opportunities for insurers to reduce claims and ensure accurate underwriting. By using online databases when providing quotes and as part of diligent claims management processes, insurers gain access to a wide range of valuable data. Accurate ground movement and mining data can be checked at the point of underwriting policies to ensure correct rates are applied.
Landmark’s updated reports “will provide insurers with secure and accurate information and also provide insurance claims data and subsidence investigations from CET Group, the Construction and Engineering Technology group, and SP Property Services to establish those areas that have previously experienced subsidence issues and where this could be a problem in the future.
Brine Subsidence information is also available to identify areas potentially affected by subsidence due to brine solution. Such resources can raise the bar in claims management and help to prevent false claims – an increasing problem in the wake of the recession.
The use of motionmap UK (and bespoke PSI data) is an increasingly vital tool for developers and one that is overtaking more conventional mapping techniques. The vast number of projects being undertaken across the UK has driven a demand for greater knowledge of the history of potential sites.
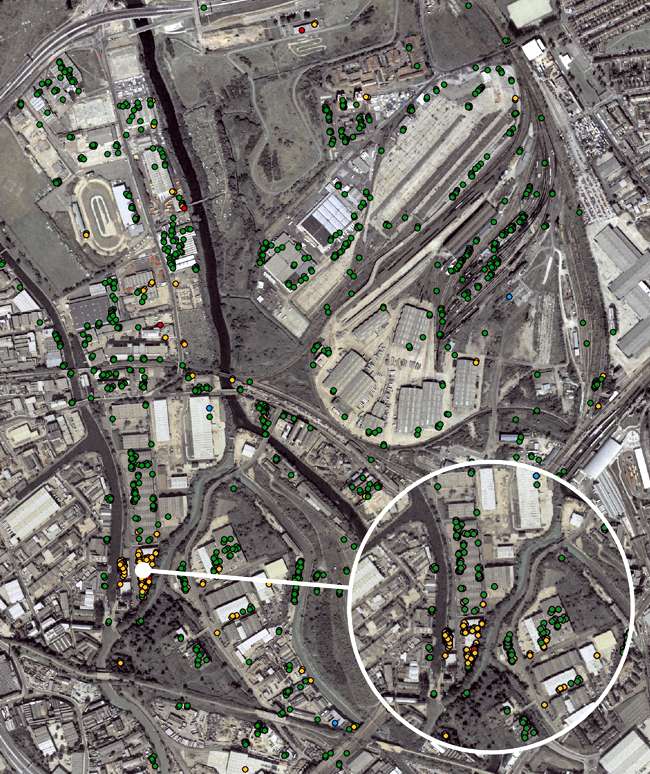
This is particularly significant with the multiple projects being undertaken for the 2012 Olympic Games (see figure 3) as vast areas of land undergo significant transformation.
When in 2004 the European Environment Agency (EEA) unveiled a digital map illustrating the multiple changes experienced by Europe’s landscapes between 1990 and 2000 a message was sent to the developers and policy makers across Europe.
The maps were designed to draw lessons on how decisions in areas such as agriculture and transport are impacting upon land resources and the wider environment. Much has changed since the release of these maps but one thing remains; accurate mapping data is vital to the development process and will continue to inform ground specialists about Europe’s ever changing landscape.
Civil Engineering
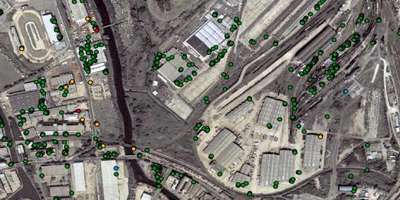
The Olympic Park in Stratford, London is a large sporting complex currently being developed for the London 2012 Olympic Games. Figure 3 shows a motionmap of UK data overlain across aerial imagery acquired in 1999. The data shows the region to be historically stable (green points) except for an area of localised subsidence (orange points representing ground subsidence of between 3.5 and 5 mm/year) mapped in the south west sector of the site.
Flood Risk Modelling
Since 1997, Defra and the Environment Agency (EA) have been funding research to measure long term changes in land and sea levels around the coast of Great Britain and along the Thames Estuary and River Thames. The aim of this research is to obtain direct estimates of current changes in land level on the scale of millimetres per year, in a stable reference frame, both at tide gauges and at other specific locations, and to use these to obtain estimates of changes in sea level (decoupled from changes in land level). Bespoke PSI data has been used in conjunction with GPS, absolute gravimetry and tide gauge readings to help obtain these estimates.
The results revealed that PSI data, although relative, is more accurate than GPS (in the vertical domain) and, as a result, could be used to correct absolute GPS measurements and increase their long term accuracy. The project revised sea level rise estimates from 1 mm/year to a net increase of 2-3 mm/year over the past few decades, by taking into account ground subsidence.
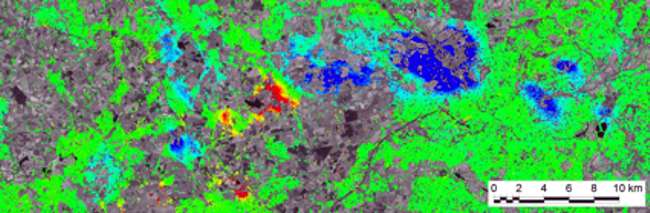
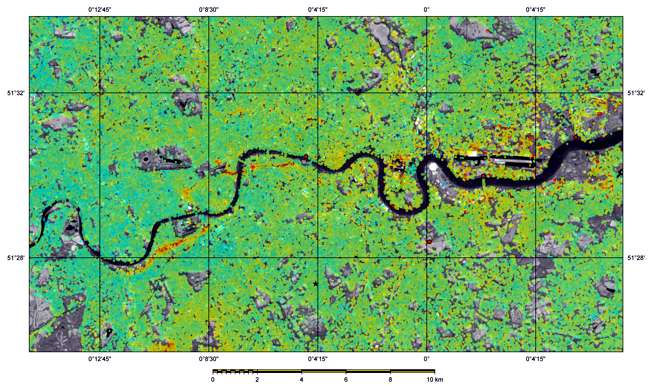
The image shows bespoke PSI data, spanning from March 1997 to December 2005, across the Thames Gateway region of London. Blue areas indicate uplift of more than 5 mm/year; Red areas indicate subsidence of more than 5 mm/year, and green areas indicate relative stability. Red markers indicate the location of GPS stations.
————————————————————————————————–
Article written by David Mole (Managing Director at Landmark Environment) and Adam Thomas (Project Manager at Fugro NPA)
