 International efforts to mitigate climate change hinge on limiting global anthropogenic CO2 emissions. About 12 percent of these emissions are due to deforestation and forest degradation, mostly in developing countries. To limit forest emissions, in 2008 the United Nations launched its Collaborative Program on Reducing Emissions from Deforestation and Forest Degradation in Developing Countries (UN-REDD). Building on the convening role and technical expertise of the U.N.’s Food and Agriculture Organization (FAO), Development Program (UNDP), and Environment Program (UNEP), it supports nationally-led REDD+ processes and promotes the involvement of all stakeholders, including forest-dependent communities, in national and international REDD+ implementation. UN-REDD is one of the more slowly moving REDD programs because it has 51 partner countries at the table, each with a different perspective on policy.
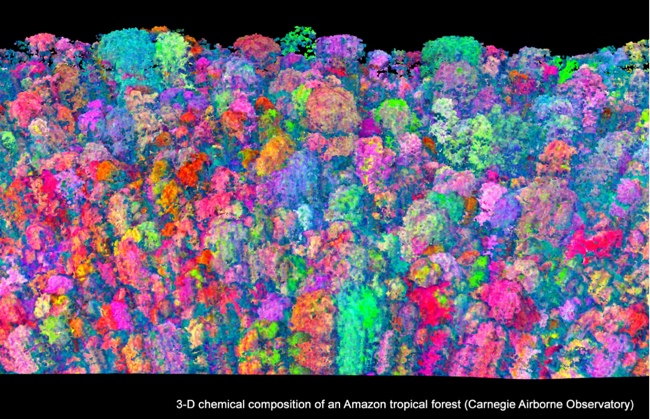
Above-ground biomass absorbs carbon when trees are alive and releases it when they die or burn. The amount of carbon stored in trees is about half of the dry weight of its biomass. To participate in UN-REDD, a country needs a baseline measurement of the total carbon stock in its above-ground biomass and must then monitor this quantity over time to assess the amount of CO2 that it releases into the atmosphere. If it finds out that it is emitting less CO2 now than in the past, it might be able to get some credit for that. Therefore, the key technical question under the program’s monitoring, reporting, and verification (MRV) provisions is how to monitor the amount of carbon in forests that are being considered under the program, which requires both measuring the height of the forest canopy and understanding the mix of species it contains.
“How to actually know where the carbon in the forest is spatially is turning into one of the biggest challenges,” says Greg Asner, Staff Scientist in the Department of Global Ecology at the Carnegie Institution for Science. In the past, UN-REDD policy allowed for estimation of carbon stocks in forests at the level of large regions or entire countries by sampling for carbon in forest inventory field plots. Nowadays, however, it requires detailed maps of carbon stocks. “Obviously, you cannot produce them with field data alone. So, we’ve been asked many times by governments involved in the UN Framework Convention on Climate Change (UNFCCC) to try to work on the ability to map carbon in a very spatially explicit way.” Without good monitoring it is impossible to implement good policy to sequester carbon in forests. “It would be like having a bank account and depositing money into it without ever getting a proper report from the bank as to whether your money is growing or not.”
One challenge for REDD programs is to make sure that an action taken to conserve carbon in one part of a forest does not simply displace emissions—for example, when loggers, banned from one area, move to another. Ensuring that does not happen would require systematically mapping carbon stocks and emissions throughout the entire surface of all the forests of the world, rather than project-by-project as is currently done.
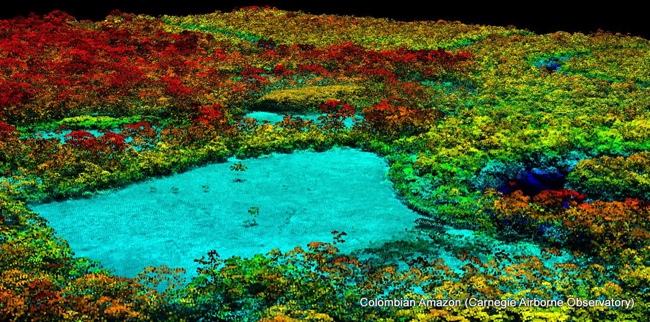
A basic scientific question underlies all of these studies: how does the carbon vary on the landscape? “Is it all pretty similar unless someone cuts it down and removes the forest?” Asner wonders. “What are the natural controls on the carbon stocks? Is it just elevation? Is it geology? Is it the species composition that controls a lot of the biomass or carbon variation? How do those come together? How does climate affect it? We are answering these questions very well region by region, but we still don’t know enough globally.” The greater the scientific understanding of the spatial variation in carbon stocks and what controls them, the more accurately researchers can calculate carbon emissions.
Accurately estimating the amount of above-ground biomass is a complex task. One way is by sampling forests using field plots, which is very labor-intensive and hard to replicate or keep consistent. “You can set up a one-hectare plot, put a tape measure around every tree stem with a diameter above, say, 10 centimeters, measure the height of the trees or estimate them with a hand-held laser range finder, and take a wood density core, then you can pull all that together and estimate the biomass of that hectare,” says Asner. His team, which consists of very fast and highly experienced field researchers, can cover a hectare this way in about three days in the field plus several days back at the lab. While these traditional field plots remain important, they are now increasingly used to develop calibrations for lidar data.
A faster but less accurate way is by using data from Earth observation satellites. “It can be like painting by numbers: you have broad land cover classifications and you have field data and you make relatively coarse maps,” says Ralph Dubayah, Professor in the Department of Geographical Sciences at the University of Maryland. In the past, he points out, this method has been dominated by multi-spectral optical sensors—such as Landsat—and to some degree it still is. The key advantages of this method are that the data is freely available and covers most of the planet on a regular basis.
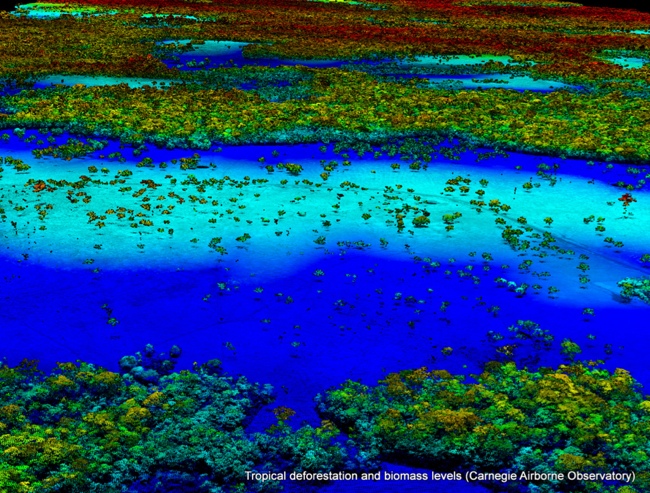
A third method is using airborne lidar, which provides superb measurements of forest structure. However, most lidar systems have to be flown low and slowly and therefore have a very narrow swath width, which can make it cost-prohibitive for use over large areas. “You’d like to have a relatively high point density, somewhere between five and seven lidar returns per square meter,” says Dubayah, “especially to have a REDD-quality site and to get at the vertical canopy structure well enough.” The problem becomes even greater if you are monitoring through time, he points out, because most REDD countries cannot afford to have all of their forests flown every few years at a sufficient accuracy and density to get maximal REDD credits for it.
A spaceborne lidar would combine the global coverage afforded by passive satellite optical systems with the accuracy of lidar measurements of canopy structure.
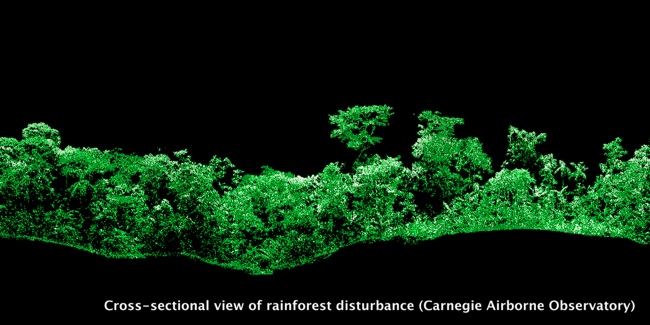
By linking lidar data from small forest areas to global satellite data researchers combine the accuracy of the former method with the coverage and affordability of the latter. They are developing cost-effective and scalable methods to identify and collect all the data required to address the various aspects of REDD policy.
“There’s been a huge amount of work in that area. We have produced many reports, papers, and capacity-building guidelines for others to consider using,” says Asner. “The data that are required are a combination of spatial data, usually from satellites, that help us understand the forest cover and certain aspects of the forest environment; then, some way of converting those satellite data to carbon stocks.” Data from airborne sensors, especially lidar, have been central to the effort to understand forest structure and develop these conversion methods.
In the past couple of years, the science community has figured out how to map carbon from lidar with error levels that are as low as putting tape measures around the trees by hand, according to Asner. Moreover, researchers can now do this in almost any kind of forest—whether a lowland Amazonian forest or a montane one, a primary forest or a secondary one, a logged forest or a totally pristine, untouched one. Now, the alternative to the labor- and time-intensive field plot sampling method is to fly an area with a lidar, apply the nearest universal calibration equation, and get a result that is within ten percent of that calculated using the field method. “But we’re flying more than 100,000 hectares a day!” says Asner. “Just two years ago, I could not say that we could do it with ten percent uncertainty relative to field-plot estimates. Now we have produced it and very solidly published that result several times.” Additionally, he points out, Ralph Dubayah’s group at the University of Maryland recently published a paper that also shows ten percent uncertainty in totally different forests and other groups have achieved the same results. “That’s a huge, amazing step.”
Converting lidar data to carbon estimates with a ten percent uncertainty also requires knowledge of the species composition of a forest—for example, whether it is an Amazonian rainforest, a temperate hardwood forest, or a desert shrubland—because the average density of the wood depends on the type of forest. That’s not a problem, however, as “we have pretty darn good maps of vegetation types,” says Asner. “This is where the scientific community has come together through collaboration and competition to produce the databases to support the interpretation and calibration of lidar data in a more systematic way.”
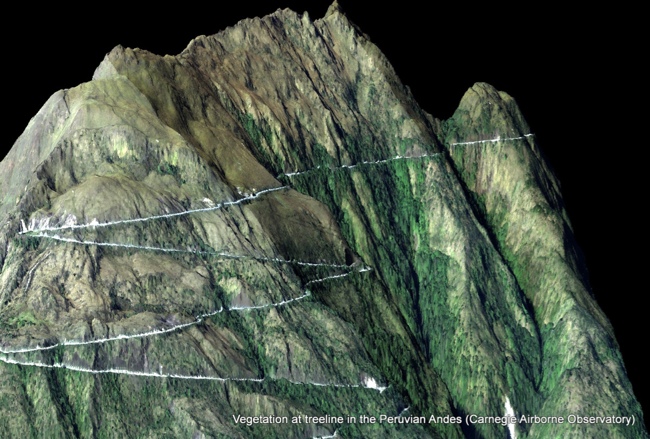
While Asner and his team have been working their way up from field plots to global estimates, other researchers have been approaching the question of carbon stocks from a global perspective—starting with field measurements and all the way to data from global satellite sensors. These data are freely available and provide global coverage, but their spatial resolution is much too coarse to be used to manage forests so as to achieve REDD goals.
In 2012, Alessandro Baccini, a scientist at the Woods Hole Research Center whose line of work focuses on the use of satellite observations to quantify the carbon stock and measure the carbon density of the vegetation in the tropics, joined forces with Asner’s group at Carnegie. Using a small amount of airborne lidar data, they recalibrated Baccini’s global map in a given region. “You could call it down-scaling, from global to Peru, or from global to Colombia,” says Asner. “It worked really well. We came up with a methodology for that process and it’s the first to work anywhere on the planet.”
His work, Baccini says, “provides a cost-effective methodology to come up with a wall-to-wall, spatially explicit estimate of the carbon density in the vegetation, using a combination of field observation and satellite data.”
Satellite data collected over tropical areas need to be processed to address issues with cloud coverage, which optical sensors cannot penetrate. “What is most important for the downscaling exercise is having access to good airborne lidar data that are representative of the biomass distribution present in the region,” Baccini explains. “We then use state-of-the-art machine learning algorithms that have been very successful in generating those estimates.”
How the quality of the data varies from the regional to the global scale depends on your final objective, says Baccini. “If a country wants to know its total carbon stock, in most cases it can just use one of the global data sets, because, as you aggregate data over large areas, estimates tend to converge. But, if you are part of REDD, which is project-based, and you are looking at a region, which is about the size of a U.S. county, then you might miss some detail. Not only that, but the global data set will probably be calibrated with data that are not coming from exactly the same type of forest and vegetation that you have in your region.” Therefore, recalibrating this global data set with local data will achieve a better estimate.
One of the remaining technology challenges in mapping and monitoring carbon stocks and emissions from forests is about error and uncertainty. UN-REDD does not yet accept lidar or any method in particular that can deliver very high resolution with uncertainty estimates of carbon stocks, says Asner. “They are still watching and listening and tuned to the work and research that is going into this, but it is evolving so fast that there hasn’t been any real uptake using the latest technology in the UN-REDD world. Not even close.”
UN-REDD’s MRV issues guidelines as to what to report and how. For example, it is acceptable to use field plots with a certain kind of sampling array to estimate the amount of carbon in a forest and to report that. Reporting can be done at one of three levels of detail, called tiers, where Tier 1 is the most basic level and Tier 3 is the most advanced level. Tier 1 can be as simple as showing a forest in green on a map and calculating the amount of carbon by multiplying an estimate of carbon density in field plots by the total acreage of the forest. “Tier 1 helped some countries enter into the UN-REDD MRV, but it is so uncertain that it produces many problems, because you don’t really know where the carbon is in the map and you don’t know how it is changing inside the map.” Tier 3, on the other hand, requires very detailed reporting of carbon stocks, with models and spatial data, and includes guidelines as to the uncertainty level to report, but does not mandate the use of any particular technology.
Due to the speed of technological change in this area, UN-REDD still lacks specific guidelines about lidar. “How could they possibly keep up with it when every month articles are coming out in the science literature showing not just where lidar worked well and where it did not, but also how to convert lidar data into carbon stocks in a way that is universal and can be done in real time, right in the aircraft? That was not true 24 months ago. So, that’s a hot, leading edge, scientific technology point for the whole program and it is way ahead of the UN documentation.”
Until recently, airborne lidar data have been limited and expensive. Now, however, the number of companies offering this kind of data is growing and prices are dropping. Airborne lidar produces a huge amount of data; however, advances in cloud computing and parallel computing have made it easier to store and process these data. “The fact that many companies now are getting into this business also helps,” says Baccini. “Competition improves the quality of the product.”
For the past 20 years, Dubayah and his team have been engaged in advancing the science and the technology of measuring biomass by using active remote sensing systems to help characterize vegetation structure. In addition to yielding better estimates of above-ground biomass, he says, this provides inputs to prognostic carbon models that help predict the future under climate and land-use change scenarios.
Besides being costly, airborne lidar data requires private companies to collect it, which is done at the project or national level, and the quality of the data depends on the sensor used and the skills of the operator. “It would be much easier if we actually had a global sensor that was able to provide high-quality data so that they were consistent all over the globe,” says Baccini. “Some of those off-the-shelf sensors are not perfect for this collection task, so there is always the risk that the data are not as good as they could be. By having a satellite in space, the data are going to be consistent and probably free and that will definitely help developing countries, which often don’t have many resources to invest in data acquisition.”
There was a space-borne lidar, NASA’s ICESat mission, from 2003 to 2009. ICE stands for ice, cloud, and land elevation. However, according to Dubayah, ICESat data was not optimal for predicting biomass, because it was very sparse, with as much 20 kilometers between adjacent tracks at the Equator. Researchers had to use data from passive optical or radar sensors to cover the areas between these tracks. This type of data fusion, especially between radar and lidar, accelerates research, given the widespread coverage and availability of radar.
ICESat-2, slated for launch in 2018, will provide new lidar data at the global level. It is a fundamentally different kind of lidar that uses what is called “photon counting” or micropulse lidar. “In a nutshell,” Dubayah explains, “you emit a laser pulse toward the ground but your sensor now is sensitive to individual photons that come back and you are essentially counting how many photons you get back. The system in space needs a lot less laser power; however, in the case of ICESat-2, it is a blue-green wavelength system that is optimized for ice sheets. In tropical areas it is probably not going to measure canopy heights to the required accuracies. In temperate regions, there is some hope that you will be able to get heights at some type of resolution and accuracy that facilitates biomass mapping. However, there is no vegetation requirement in the ICESat-2 mission, other than to collect data, because the technology is too new.”
Dubayah’s team has also been working with NASA Goddard Spaceflight Center to develop a vegetation-optimized lidar to deploy on board the International Space Station. “Our system is a waveform lidar, like the first ICESat, but with a smaller footprint of about 25 meters and with many beams, separated across track by only 500 meters. That would provide all the data you need to have a very stable, transparent, and accurate assessment of global biomass in the temperate and tropical zones at fine spatial resolution.”
For further reading: Scott Goetz & Ralph Dubayah, “Advances in remote sensing technology and implications for measuring and monitoring forest carbon stocks and change,” Carbon Management (2011) 2(3), 231–244; http://www.future-science.com/doi/pdfplus/10.4155/cmt.11.18