 In recent years, EPCOR Water Services of Edmonton, Alberta, Canada has run highly visible city-wide water conservation campaigns. EPCOR Water serves 1 million customers with 240,000 fully metered service connections, 2 water treatment plants, and 3,500 km of pipeline. Along with raising water conservation awareness, the campaigns were specifically designed to reduce summer demand. Limited treatment capacity made it necessary to reduce consumption levels during the high demand summer lawn watering season. The water conservation campaigns with a heavy focus on summer lawn watering reductions were successful, delaying the need for the facility expansion from ~1990 to 2006.
The Need for New Conservation Messaging
In 2008, a $140M capital investment doubled the available summer capacity of the E.L. Smith Water Treatment Plant. As a result, the operational need for reduced summer demand communicated by the old water conservation campaign no longer existed, and a new meaningful strategy was required to promote responsible water usage. To determine the revised platform, research was required to better understand water consumption in Edmonton at a comprehensive level.
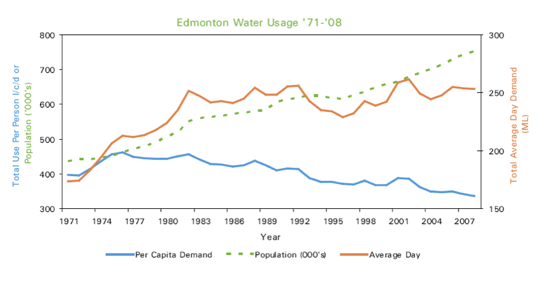
The changing overall water consumption patterns in the Edmonton region since 1971.
To gain this understanding, EPCOR drew on the GIS methodology presented in a seminar entitled “Green GIS” at the 2008 Geospatial Information Technology Association (GITA) Annual Conference in Seattle. In this seminar, John DiStasio presented a case study on how Sacramento Municipal Utility District (SMUD) completed an analysis to segment their electrical customers to customize their programs for energy efficiency, and improve customer servicing messaging.
Research was undertaken using geospatial analysis in three focus areas:
• Residential/multi-family consumption
• Commercial/industrial consumption
• Customer outreach techniques
The study proved to be a cost effective method to determine the highest residential and commercial user groups in Edmonton, and identified opportunities to target specific audiences with the greatest potential for water reduction.
Residential / Multifamily Consumption Analysis
The residential and multi-family consumption analysis was developed by mapping individual customer accounts from EPCOR’s billing system into the GIS system. This allowed for a comparison of water consumption by size of property lot, and thematic grid maps were produced. This information was then combined with demographic information available from the City of Edmonton Planning and Development Department and the Federal Census.
The result of the study was a detailed understanding of residential water consumption patterns based on geography, neighbourhood average income, lot size, neighbourhood per capita consumption and age of home. The following are several of EPCOR’s findings from the analysis.
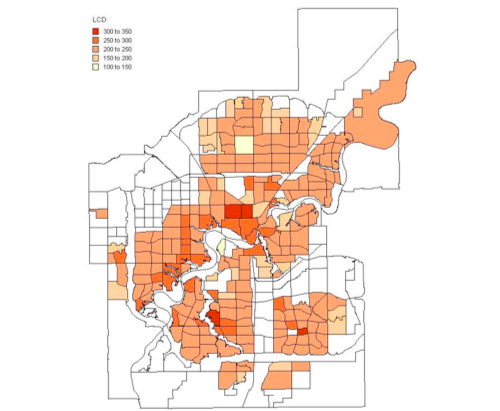
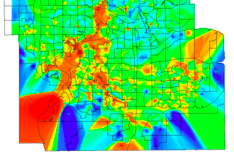
Consumption per capita per day for each residential Edmonton neighborhood showed where EPCOR’s conservation messaging needed to reach.
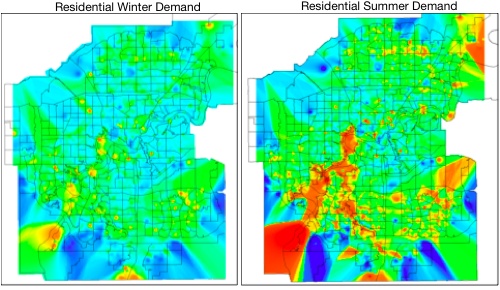
EPCOR used GIS to develop a series of thematic grid maps illustrating the distribution of water consumption across the city. Blue indicates areas of low demand, green indicates average demand and red is attributed to high demand. Locations of high demand at the peripheries of the city (i.e. SW), should be discounted as there are small numbers of relatively high users in areas that are largely undeveloped.
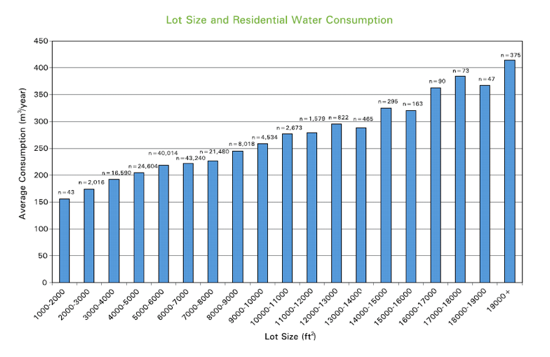
As anticipated, EPCOR reported a direct correlation between the size of the property and the amount of water consumed in a year. This reflects the continued impact of outdoor watering on water consumption per account.
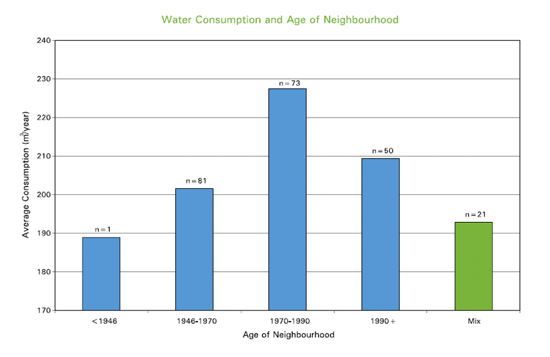
The review validated a theory internal to EPCOR that water consumption was dropping in older homes due to renovation rates. Edmonton has a large inventory of homes built through the 1970s that should start to see a reduction in base demands as older style fixtures are replaced in the coming years through natural cycles.
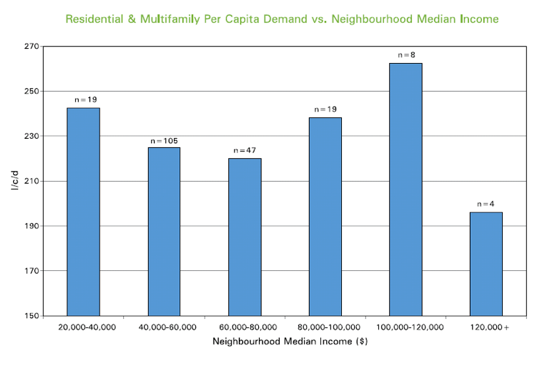
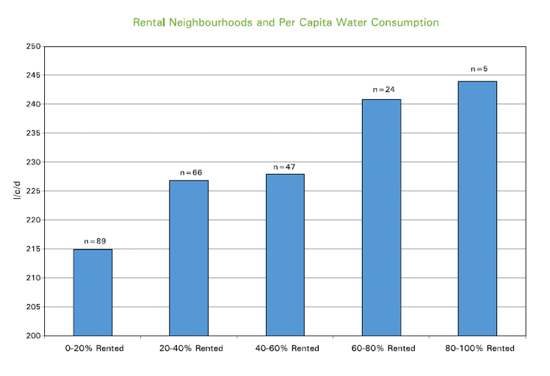
The analysis showed the expected trend of higher per capita water use as income levels rose in the neighborhood. The $120,000+ median income range should be discounted due to its low sample size (further analysis following publication revealed errors in reported population and consumption of two of the four neighborhoods). However, the trend also showed that the second highest use of water occurs in lower income neighbourhoods. This result is consistent with similar findings from a few communities in the United States. In these communities, further analysis indicated that the higher consumption patterns were being driven by restrictions on residents within low income areas to acquire new efficient fixtures or their ability to repair leaking fixtures. Often in these areas homes were rental properties, putting further restriction on the ability to modify them. Rental fees with built-in water consumption reduced the incentive to manage leaks or install efficient fixtures.
To calculate consumption per unit for comparison to other apartments, EPCOR combined data from Edmonton Waste Management concerning the number of units in each apartment with consumption data. Graphs were then developed to show the range of consumption compared to average.
Commercial / Industrial Consumption Analysis
The next step of the study was the commercial / industrial analysis. The result of this analysis was the segmentation of accounts by industry, and consumption patterns for forty different businesses. The analysis was developed through a combination of GIS mapping and the addition of the North American Industry Classification System (NAICS) code to each commercial customer account. Other benefits of this study include improved account auditing and forecasting by industrial sector. The following are some of EPCOR’s findings from the analysis.
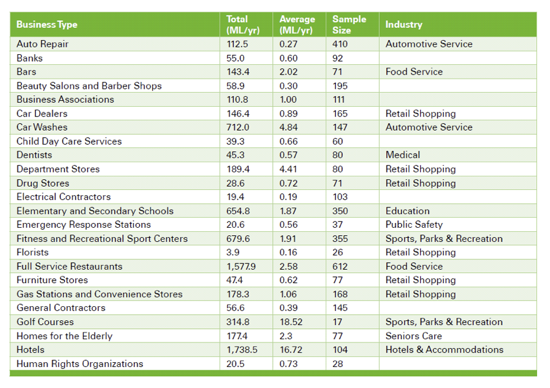
The more than 15,000 commercial / industrial customers within the City of Edmonton were assigned a specific NAICS code, and segmented into 40 business types (24 illustrated above). This provided the first detailed overview of the mix of businesses within the City and their consumptions.
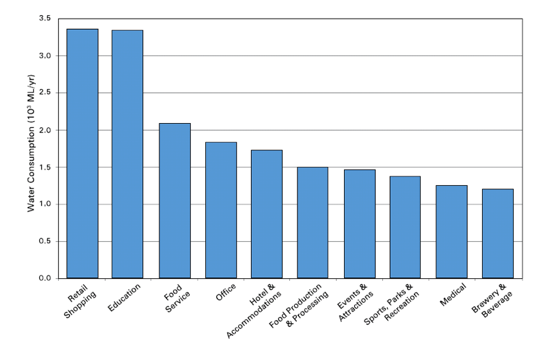
The 40 business categories were then further combined into 23 industry categories and ranked to determine total consumption per industry in the region. The chart identifies EPCOR’s top 10 water consuming industries.
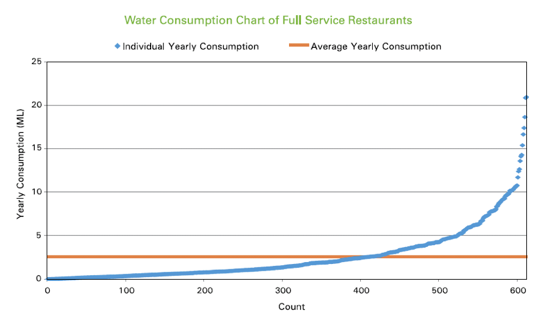
Graphs were developed for each of the forty business categories to exhibit the range of consumption across the category. The chart representing one of these forty business categories, Full Service Restaurants, is depicted above. Due to the high number of customers in the Full Service Restaurant Category (612) and the range of consumption, this category with be a targeted group in the new campaign.
Revised Conservation Strategy – The Blue Bucket Crew
Along with the demand study, EPCOR’s marketing department conducted customer research via focus groups and telephone surveys, to develop the conservation campaign. In the Fall of 2010, EPCOR launched the new conservation platform called the Blue Bucket Crew with a combination of radio ads, bus murals, vertical billboards and a microsite. The 2010 campaign was focused on building awareness of the new brand and water waste reduction.
The 2011 water campaign will build on the Blue Bucket Crew platform and once again deliver a water wastage awareness message. The target audiences as identified by the demographic analysis will be low income renters and property owners, as well as high consumption neighbourhoods. The messaging will also reach to areas in the city where transmission infrastructure upgrades are required, with the intent to defer capital investment.
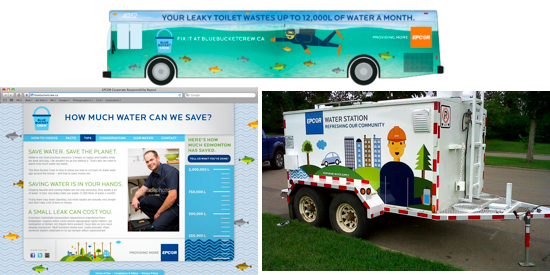
Targeted campaigns for 2011 conservation outreach include a wrapped bus (top) that will travel routes through high consumption areas, a new website with ‘How To’ videos to fix common leakage problems at low cost; and emergency water tanks with a conservation message.
The Blue Bucket Crew will take to the streets this summer with water waste reduction messaging and promotional material. They will attend a variety of community events with a focus on targeted neighborhoods where water usage has been higher than average. Grade school programs in these neighborhoods will also be introduced, including prizes to the school who achieves the greatest cumulative reduction in residential consumption. Partnerships are planned with group home facilities to repair and retrofit. Finally, property management companies with the highest per suite consumption will be contacted and educated on the benefits of conservation.
Beyond 2011, EPCOR plans to extend the Blue Bucket Crew to the top commercial customers in each category. The analysis will also be repeated on a regular basis moving forward to monitor trends and adjust conservation messaging to meet the customers’ needs.
Susan Ancel is the Director of Water Distribution and Transmission at EPCOR Water Services Inc., and is also the Past President on the Board of Directors of GITA, e-mail: sancel at epcor.ca; Heather Zarski is the Manager of Planning at EPCOR Water Services Inc., where she is responsible for long-term planning of the distribution and transmission system, e-mail: hzarski at epcor.ca.
