 3D visualisation models have a variety of applications in geography and urban studies, including site location analysis, emergency facilities planning, design review and marketing.
A pressing problem facing many of these models is their general inability to engage the vast majority of their users and the people whose lives they influence in a meaningful and intuitive fashion. Although today’s 3D models are generally used to simply visualise the built environment, there are early signs of them being used as 3D interfaces to more sophisticated modelling; for example, in the simulation of emergency response at the 2012 Olympics and in security operations at football matches.
In recent years, significant advances have been made in the development of intelligent 3D models of the built environment. Technology exists today that enables us to render visually stunning and richly detailed simulations of city environments in a manner that renders an ease of interaction and understanding which is not currently present in many simulation models. Furthermore, the addition of a third dimension to our knowledge base of city systems greatly enriches the simulation capacity of predictive models. The use of intelligent building information models (BIM) and geographic information (GI) offers much greater potential in support of city planning analysis and management applications.
This paper describes how Autodesk and Ordnance Survey have initiated a collaborative project with the primary objective of building an intelligent 3D model of the City of Liverpool in order to simulate city planning and management operations.
3D technology and application
3D city models today
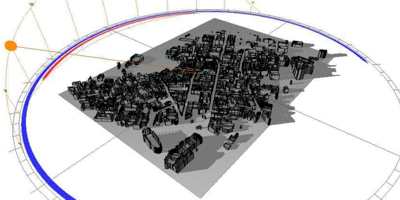
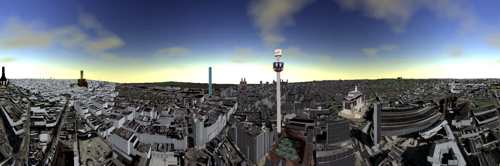
Visual images and fly-through simulations of cities in 3D environments which are comprised of basic terrain models and block buildings have become commonplace. Tools such as Google SketchUp and the widespread application of web-based mapping have greatly demystified the generation and visualisation of 3D data. Figure 1 illustrates a typical visual 3D cityscape.

At a more professional level, a number of municipalities across Europe have commissioned local surveys to develop urban 3D models for the primary functions of city marketing and engaging citizens in planning decisions.
UK examples include Sandwell Metropolitan Borough Council (Figure left) and Glasgow City Council. Active ‘Digital Cities’ projects, sponsored by Autodesk, are also taking place across Europe in a number of cities such as Salzburg in Austria (Figure right).
Your browser may not support display of this image.
Your browser may not support display of this image.
The primary objective of these projects is to allow the public greater access to and understanding of the development of local areas. This kind of activity can be very impressive if the primary intention is to create a strong image of a city or area in order to deliver an emotional “wow factor” to an audience and to gain initial attention and interest in the message or visualisation being communicated. By way of example, Figure 3 hypothetically illustrates the visual impact of a new city skyscraper.

The models are usually generated as a result of one-off investment projects rather than being maintained through sustained programmes that underpin a range of projects on an on-going basis. As a result they tend to represent ‘snapshots’ in time and become rapidly out of data or become superseded by another, more attractively rendered image. With the emphasis on visualisation and aesthetic appeal, they lack:
* the capacity to be maintained to reflect real-world change
* consistent conformance to survey standards
* attribution and metadata which would allow the execution of geographic queries and / or derivation of statistics
* Interoperability with other relevant geographic information and / or more detailed building information models; the ability to ‘zoom in’ to the model and explore more detailed information is normally restricted.
This focus on creating visual output is very similar to the situation in the 1980s when paper maps began to evolve into ‘digital mapping’ before we began to appreciate the benefits of more analytical GIS.
Current capability
Although the practice of city modelling for planning and management purposes is often rooted in a visual domain, significant advances have recently been made in 3D-related technologies – all with an emphasis on the information content of 3D data. The capability now exists to:
* Store data in standard RDBMS, such as Oracle 11
* Store data in open formats, notably CityGML
* Integrate previously disparate technologies such as GIS and building information models (BIM)
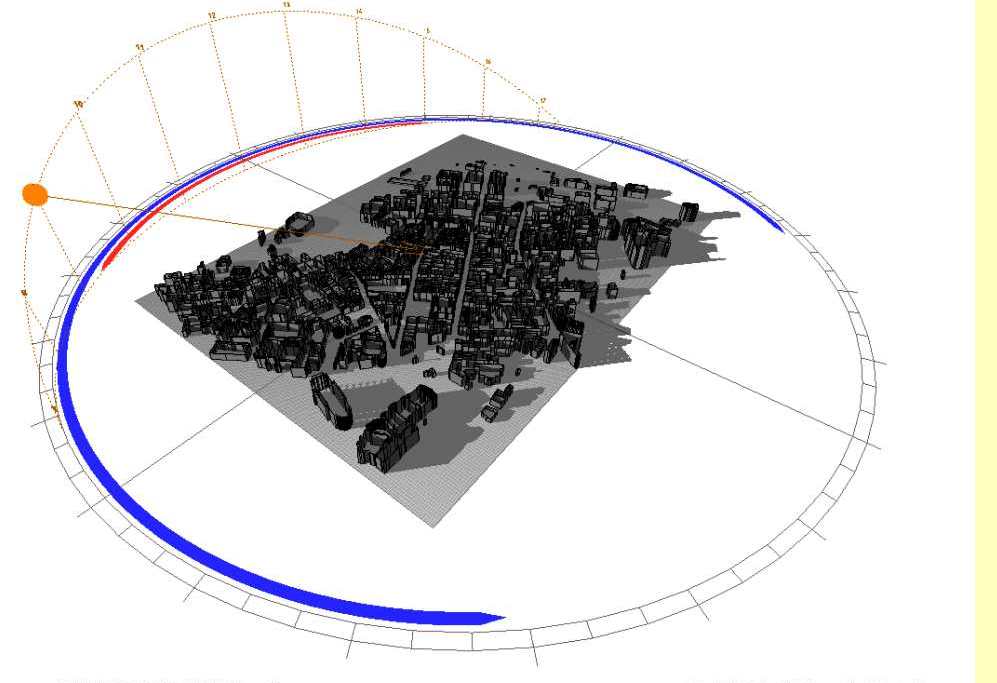
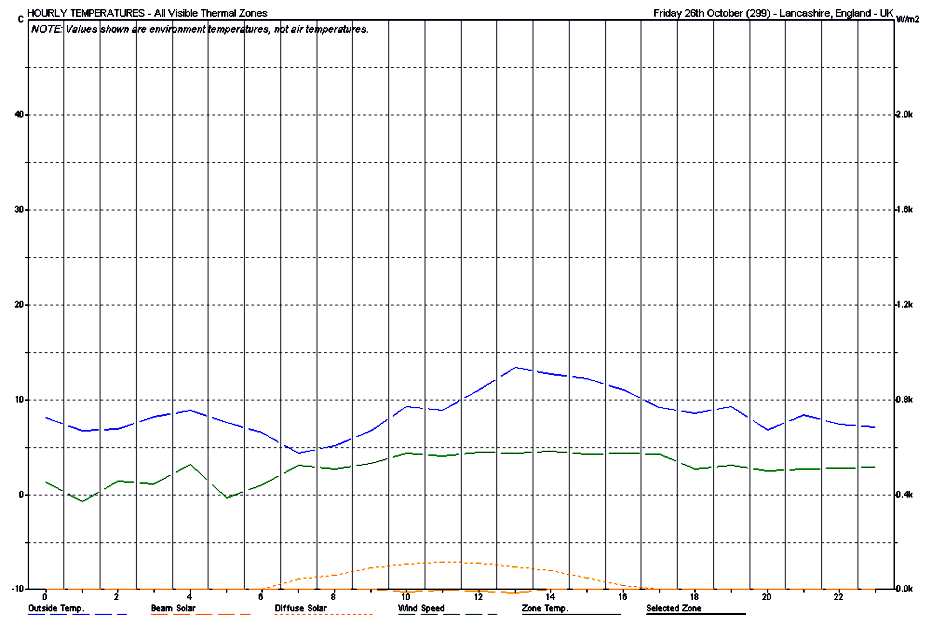
The combined impact of these developments is that we have the capability to integrate detailed BIMs with rich, data-centric 3D models to bring intelligence to what was before a picture. Analytical queries can now be run and decision-support processes can interrogate the data at a variety of scales, from a single room to an entire city in order to generate meaningful information which can be presented in a multitude of formats. By way of example, Figure 4 illustrates the impact of a proposed new development on urban temperatures based on shadow analysis.
Digital Cities – UK prototype
‘Digital Cities’ was initially introduced by Geoff Zeiss of Autodesk at the 2008 AGI Geo community conference. It is a worldwide initiative aspiring to increase the value of ‘place’ and set a challenge for the future planning, operation and public safety of cities for the benefit of local communities. In order to develop these ideas further and to provide a demonstration platform built on data familiar and widely accessible in the UK, Autodesk and Ordnance Survey have worked together to develop an intelligent 3D model of the City of Liverpool. At its heart is the development of a prototype to integrate BIM and GI datasets and software tools with serious gaming technologies in order to simulate city planning and management operations. The model is intended to act as a focal point for discussion and debate and to enable the development of use cases and a specification for 3D data and tools in the UK.
For the purpose of this project, Ordnance Survey large-scale topographic data was enhanced with photogrammetrically-generated building heights. This was further combined with Ordnance Survey aerial imagery and a number of detailed building models built with 3DS Max and modelled within LandXplorer. Figure 5 shows a city panorama based on the resultant project dataset.
Emergency access scenario
For the purpose of this exercise we considered the scenario of a managing a concert in a large venue in Liverpool. A concert of this type requires careful and specific planning and preparation relating to:
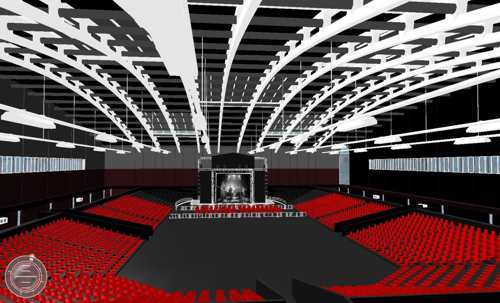
* the layout of the concert venue (Figure 6 top), its infrastructure and the surrounding area
* the location and flow of people within and around the concert venue (Figure 6 bottom)
Let us consider this demonstration scenario in more detail.
A great deal of planning is required to ensure that visitors, the structure and surrounding infrastructure will be safe both during and after the event and if a security or emergency incident were to occur, to ensure that everyone can be evacuated in a timely and safe manner. A local authority will typically task a Safety Advisory Group with this responsibility for major events.
If we take a look at a BIM we can clearly establish the location of the exits and stairways, both visually and additionally in other non-visual media and formats, such as tabular reports or XML files. Non-visual output can often be more a more appropriate method of extracting information. A BIM contains a wealth of information about the building, ranging from materials used in construction to the precise measurements of features in the finished design and is therefore the most reliable and efficient way to interrogate information about city infrastructure at a highly detailed level.
Typical queries relating to a large civic building which is being used as a concert venue may include :
* Which exits are available? Are any of these exits unsuitable to people with disabilities?
* What are the routes to direct people to the exits? What are the implications of power failure to lifts, lighting etc?
* What is the overall throughput capacity of the stairways and exits?
* Where should people congregate once they are clear of the building?
However, a standalone BIM is inadequate for wider spatial analysis and the interaction of the asset with external phenomena . Planning for a concert and for emergency evacuation scenarios requires the consideration of geographic factors outside the building itself. These may include :
* The impact of sound radiation and how that might affect the surrounding community so that we know what type of prior notifications or approvals might be needed
* The location and height of surrounding buildings, and their potential exposure to fire or radiation risk
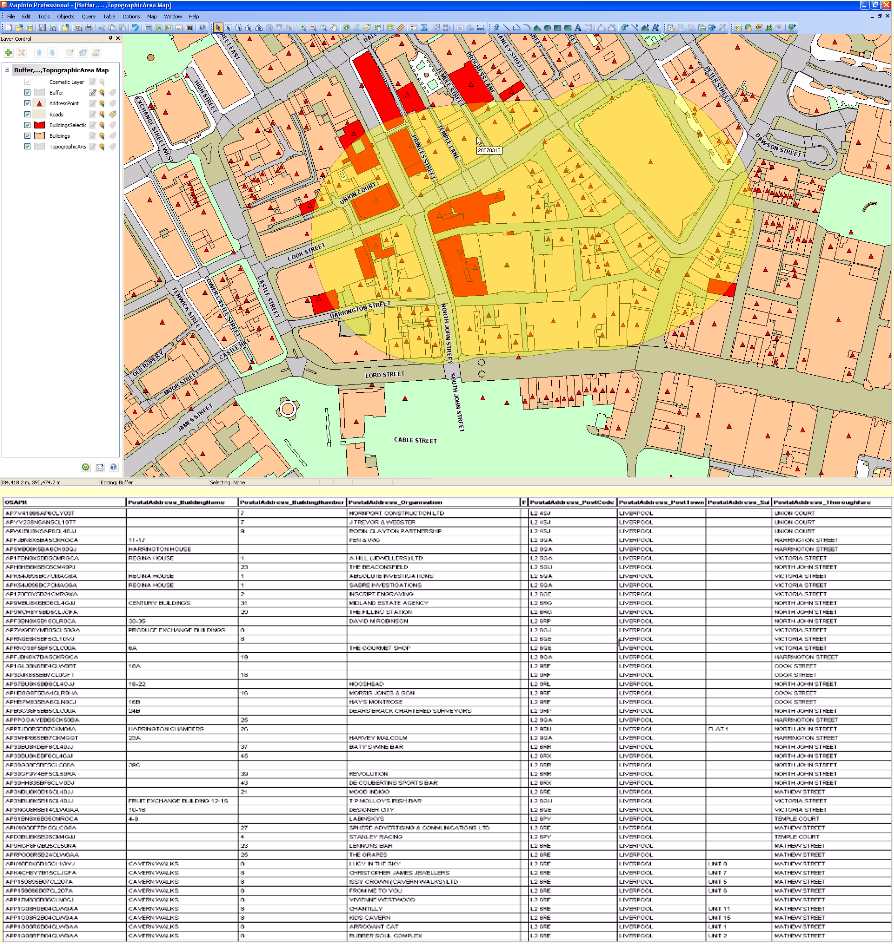
Figure 7 includes tabular MapInfo GIS query output based on the Liverpool Mathew Street Music Festival
Running scenarios in a gaming environment
So we now have our city, our building, our event and our plan; but will it work? What better way to evaluate how good your emergency plans are than to play them out virtually through the use of serious gaming tools?
Serious gaming has been in use for many years, for example by the Ministry of Defence. It is a safe and effective way of virtually enacting scenarios as they may happen in real life and evaluating responses to such events. This technology has evolved considerably of late and continues to do so very rapidly. The graphics being rendered in serious gaming environments look almost real but the underlying use of artificial intelligence (AI) is extremely relevant to real-life scenarios that could affect everyone.
We know our land and cityscape, we know our terrain and infrastructure and thanks to the use of BIM we know our building. By using gaming technology we can build up a series of “real” scenarios that we can act out virtually to ensure that our plans will work if an incident should occur.
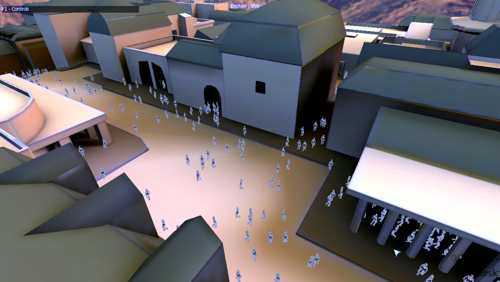
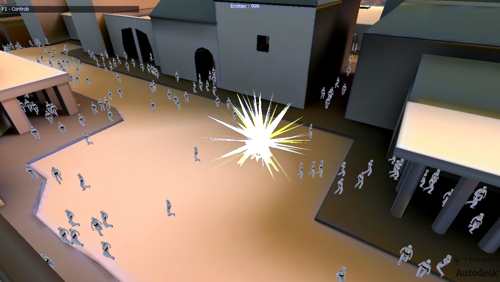
We can take our BIM, model a number of people within it, determine their age and abilities and using AI, create a hypothetical incident. We can now establish how different people will react, how quickly can they exit the building, which exits will be under pressure and which under-utilised. Above all, they can help ensure that we have several disaster plans that will work in numerous potential instances. This is illustrated in Figure 8.
We can also take into account the wider implications such as:
* emergency services access
* other buildings that might be affected
* impact on other services such as power and water in the city and beyond (in the event of a hazard such as a chemical leak)
Furthermore, we can use gaming technology to simulate the evacuation from the building to places of safety further afield using either public or dedicated means of transport.
Discussion
This is a demonstration of a complete use of the worlds of GIS, CAD, BIM, Gaming and AI – until now separate in nature – all brought together in one model to enable planning at a range of scales within and across a city. The utilisation of 3D over traditional 2D analysis provides – quite literally – an added dimension. Accessibility and radiation (of sound, light, noise etc) are inherently three-dimensional problems in an urban environment. Our vision is that underlying 3D reference information can (and will) be maintained and used over and over again as and when required. Through open formats and connectivity standards, information stores will also be connected to other systems such as routing engines and command and control systems to ensure seamless operation.
This will not happen on its own. We have moved on a long way but data still typically sits in silos and managing this disparate data can be problematic as it may involve numerous different data elements, systems and authorities, many of which don’t (or won’t) talk to each other easily. CAD and GI are not always able to interoperate. Moreover, there are still many data custodians involved in “owning” and indeed “managing” the relevant information. Nevertheless, it is possible to start bringing this information together and using it in an intelligent way as we have showcased here.
Autodesk and Ordnance Survey will work to further expand on their work in this area over the coming months to engage with the user community and further understand the precise needs and requirements of users with the aim of being in a position to help with the joining up of CAD, GI and BIM information, build further practical use cases and business cases for these solutions and start enabling the use of these tools as common practice.
—————————————————————————
Further information is available from the Autodesk – www.autodesk.com/landxplorer or from [email protected].
