 Two major challenges that users presently face in the mapping industry are the handling of mass data and the creation of really true orthophotos. Large amounts of data are produced using e.g. laser scanners, image matching, TIN creation, etc. but it is not always successfully managed. The uSMART Mass Data Module (MDM) is however capable of storing and manipulating unlimited amounts of data. Creation of true orthophotos i.e. orthophotos where the dead/occlusion areas are filled from neighbouring images, can also be done in an automated procedure in uSMART.
 Handling of Mass Data in uSMART
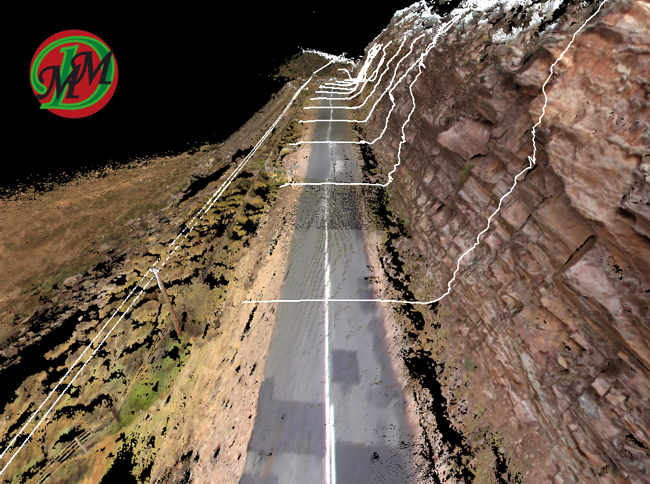
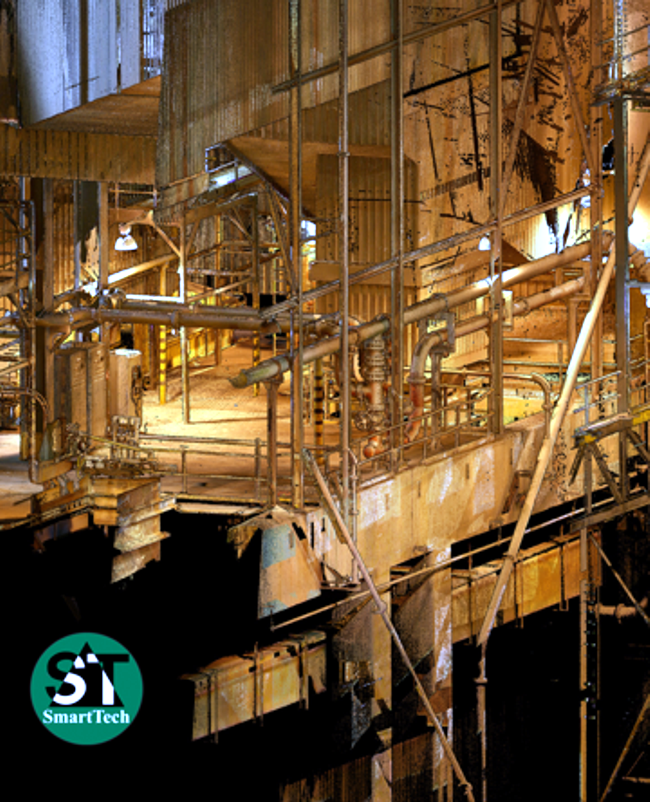
One of the biggest challenges in the mapping industry today is importing, creating, storing, displaying, editing and manipulating enormous volumes of data. There are very few systems that can for example handle literally billions of points efficiently. Even if a system is capable of importing the points, a simple refresh of the screen can take very long causing much frustration. Laser Ranging Survey techniques are becoming more popular and this will no doubt increase as these systems become more affordable. A major “problem” with these systems is the massive amount of points that are created.
The issues of slow speeds, memory problems and capacity limitations associated with the handling of many billions of elements have been addressed in the uSMART Mass Data Module (MDM); the latest module added to the uSMART Base Mapping suite, the primary software developed by the company for use with Bentley MicroStation.
The MDM not only stores and displays these points but also allows for further editing such as automatic cleaning, re-classification, thinning, etc. of the points. It is also possible to create a triangulated irregular network (TIN) from these points to generate contours, orthophotos, etc. Break lines from various sources, e.g. mapped in Softcopy, can also be incorporated into the TIN. Other elements such as curves and cells will be added to the MDM in the near future.
A few basic concepts have been incorporated into the core design of the MDM to overcome speed, memory and capacity problems. These basic concepts combined with innovative system design techniques make the MDM unsurpassed in speed, memory and capacity handling.
Elements are stored in a hierarchical cubical structure in the file and are searched for by location when required e.g. to display and/or edit elements. These cubes are resampled according to a user specified minimum resolution. Resampling creates overviews of the data (similar to image overviews or pyramids) and effectively generalises the data for optimum display speed, however original source data is always used for computations, editing, etc. Coupled with this is the speed at which the data is imported and/or created. Points can be imported (approximately 200 thousand points per second) or created from e.g. image matching (pixel correlation). A triangulated irregular network (TIN) can be created over very large areas using points and break lines.
Once the data has been added to the internal database, accessing, viewing and manipulating large files (e.g. 1 Terabyte) is fast, taking 1 second or less to open the file and sub seconds to fit the view, zoom in/out or pan into a new area. The fast speed is always applicable and subsequent viewing of the data e.g. starting a completely new session of the software, takes less than a second.
To overcome memory limitations, especially the 2 or 3GB virtual memory limit of the 32bit Windows architecture, a disk and memory based system was developed. Memory usage is controlled by the user and once the specified memory limit is reached the information is swapped to disk. Swapping to disk is not random i.e. it is controlled by the MDM and memory defragmentation is incorporated to automatically clean up defragmented memory. Routines are optimised to take evasive action when there is a shortage of memory during usage. The user can therefore set a much higher memory usage value while for example, creating TINs which drastically increases the speed of the TIN creation.
In real terms there is no limit on the capacity of the data as each file can be a maximum of 9,223,372 Terabytes in size and users can open as many files as the operating system will allow in a single project. Currently typical hard drives are around 1.5 TB, but the MDM easily overcomes this hardware limitation by allowing users to edit data across many files simultaneously i.e. it is not restricted to the “active” file.
Most of the existing uSMART tools applicable can be used for the MDM elements i.e. there is not a different set of tools to learn. Many of the MicroStation tools can also be used. The goal was to ensure that the MDM works seamlessly in MicroStation e.g. points can be snapped to in the same way as you would to normal MicroStation elements. MDM elements are saved in a *.md file which can consist of an unlimited number of Groups (similar to MicroStation’s Models) and Layers (the equivalent of MicroStation’s Levels). Although the user specifies whether the elements must be stored in DGN or MDM, this is completely transparent i.e. users need not see the difference between DGN or MDM elements as they all display in the MicroStation View and can be manipulated using the same tools.
Below are a few practical examples of problems that are addressed by the MDM:
True Orthophoto Creation in uSMART
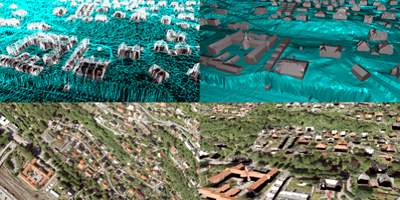
3-D city modelling is becoming more prevalent in the industry and is of great importance to our existing clients. True orthophotos i.e. orthophotos that are not only corrected for building lean, etc. but also exhibit no dead/occlusion areas are often used as part of the modelling process and some of the current routines in uSMART were recently extended and improved to simplify the creation of true orthophotos.
Various methods have been proposed and implemented to create true orthophotos. After studying a number of papers and discussing some key issues with our clients, the developers at SmartTech decided to use a triangulated irregular network (TIN) that substantially represents the roof geometry of the buildings to determine the dead/occlusion areas. The first part of creating true orthophotos was therefore to incorporate mapped roof features into the TIN representing the terrain.
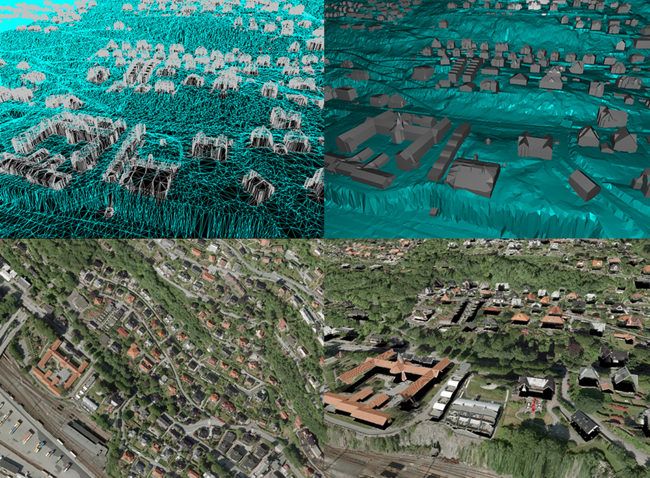
uSMART Structures (buildings) can be automatically incorporated into the TIN. Existing mapped lines are made into uSMART Structures at the press of a button, allowing users to utilize the data that they already have. New structures may be added and buildings may be changed at any time. The uSMART Structure routines cater for any level of detail. With the uSMART MDM, it is possible to TIN massive areas. Whole cities, even entire countries can be done at the same time without having memory and speed problems.
After creating the TIN, “Hidden Area Shapes” are automatically created to determine the occlusion areas. Shapes are created for each building using the surrounding perspective centres (PCs) from which the building is visible. Users specify the maximum number of PCs and only the closest ones are used. Thousands of these shapes are created for a city and are used to obtain the necessary pixels from the surrounding perspective centres for each building.
The uSMART Orthophoto module generates fully rectified images in minutes. These orthophotos are perfectly balanced and feathered images. It will not be possible to see any seam lines even across buildings, roads etc. Orthophotos can be clipped, merged etc. to any user required size. If the building roofs are mapped, buildings will be correctly rectified planimetrically i.e. they will exhibit no lean. In addition to these existing features, it is now also possible to fill in dead areas using pixels from the surrounding images. True Orthophoto creation is a totally automated procedure that is accomplished without any user intervention. The creation of thousands of orthophotos can be fast and automatic because of the power of the MDM. With the TIN residing in the MDM, memory usage is controlled and orthophotos can be created over very large areas.
Typical problems include “roof pixels” being placed on the ground and colour differences in the “new” pixels. There are some manual measures that users can implement to minimise these problems such as mapping building lines on the outermost edge of the building i.e. as far out as possible. A “thick” wall should therefore not be mapped in the middle of the wall but on the outer edge. These precautions do not however always solve the problem and further tolerance values can be set to be applied to the shapes to prevent roof pixels being placed on the ground. All tolerance values are user configurable and may be changed according to the level of accuracy etc.
Fundamentally there are two processes involved in creating true orthophotos in uSMART. The first is to create the uSMART Structures (buildings) and the second is to incorporate these Structures into the TIN. Below are the typical steps that are followed.
If the buildings have already been mapped, these steps may be combined into one batch procedure for automatic processing. SmartTech’s approach to the ever changing mapping industry is a positive one, as we anticipate new challenges in the future.
—————————————————————————————————–
Written by Karen Bester, Systems Analyst and Support Specialist, SmartTech
For more information on uSMART, including information regarding a demonstration version of the uSMART Software, please visit our website www.smarttech.co.za.
Email: [email protected]
Telephone : +27 21 713 0126
