 Visualization of three-dimensional spatial data is a challenging task which can be efficiently solved using various kinds of oblique views. Oblique views are common in 3D computer graphics: for instance, a perspective view is an intuitive and illustrative way of presenting, for example, architectural or land use plans. Perspective has also been used for years in mobile navigation systems such as car navigators. The increased availability of three-dimensional software and data sets has led to a wide interest in 3D computer graphics among cartographers as well.
Cartographic principles
Creating oblique views suitable for maps requires consideration of the cartographic principles. Cartographic visualization focuses on scaling down, generalizing and abstracting real-world views. The purpose of a map is to provide the user with a symbolic representation of the most salient spatial features of the surroundings. Furthermore, the principles of 2D cartographic visualization should be applied consistently throughout the view and these principles should be applied in 3D as well (see Häberling et al., 2008).
A conceptual distinction should be made between cartographic 3D rendering and what we often see done in 3D computer graphics. The mainstream of 3D computer graphics follows the photorealistic rendering paradigm, which aims to reproduce real-world views in every detail. Cartography, in contrast, aims to simplify the visual details of the real world. Thus, cartographic 3D rendering can be seen to follow the so-called non-photorealistic rendering paradigm (Döllner, 2007).
Oblique parallel projection
A viewing projection defines how the 3D model of the environment is seen at the presentation plane. In graphical illustrations of landscape, we are mostly faced with the perspective projection, that is to say, a bird’s eye view. Perspective projection is particularly illustrative because it imitates human sight and, therefore, it is the most used viewing projection in photorealistic rendering.
However, from the cartographic point of view, the use of perspective has its drawbacks. It is a central projection which has a single focus point in the space, meaning that it gives one egocentric view (Meng, 2007) from each viewpoint and from each viewing direction. In addition, the central projection causes the scale of the perspective view to change continuously throughout the image, which makes measuring and the estimation of distances and directions difficult. Thus, the cartographic requirement for consistency of scale over the view is not fulfilled with perspective projection.
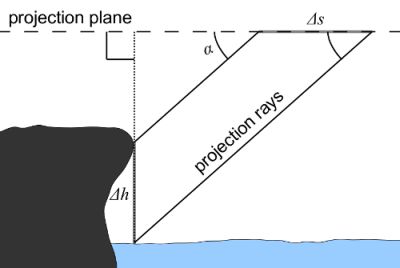
Figure 1 shows the difference between the perspective and oblique parallel projection. The square grids in the figure depict the scale change in different projections. In the oblique parallel projection, there is no deformation present at all in the east-west direction, which can be seen from the straight north-south lines. The east-west lines of the grid present the height profiles of terrain and show the displacement of the north-south direction in the view, depending on the height.
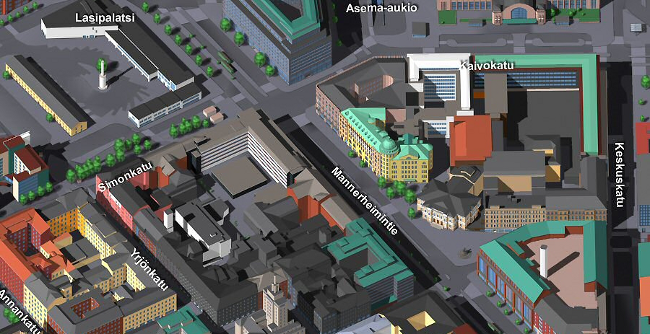
When the aim is to make an image with an oblique viewing projection and, simultaneously, take into account the requirements of cartography, parallel projections appear to be suitable. These are well-known in cartography and they are often used on 3D city tourist maps (Figure 2). There are many types of parallel projections, the common feature of which is to preserve the parallelism of lines from 3D to 2D. This means that the scale of a projected view remains constant on the planes which are parallel with the viewing plane. For instance, placing the viewing plane of the map horizontally over the ground results in preserved shapes of the horizontal ground features, such as lakes. This is ideal from the cartographic point of view.
In order to make an oblique parallel projection, the horizontal viewing angle is set at less than 90˚ (Jenny and Patterson, 2007). Consequently, the vertical forms of the terrain become visible together with the uniformly-rendered horizontal forms. In addition, horizontal and vertical scales are preserved throughout the view, which matches with the cartographic requirements. The oblique views in oblique parallel projection imitate the orthographic projection of conventional maps and, simultaneously, visualize the vertical dimension of the terrain in a relief-like manner.
Rendering experiments
In this study, we carried out experimental renderings in oblique parallel projection using Natural Scene Designer Pro 5.0 software. The purpose was to experiment with applying the oblique parallel projection to portray terrain in a cartographically pleasing way. The visualisations were based on a digital elevation model (DEM) of Nuuksio National Park in southern Finland (Sarjakoski et al., 2007).
The 1 m resolution of the DEM, with a height accuracy of about 20 cm, provides a detailed depiction of the terrain. The area is hilly, but since the elevation differences are only several dozen metres, 3D visualisation at smaller scales is challenging. Small height differences vanish in small-scale views over large surface areas.
Parameters of three-dimensional rendering
When rendering a 3D oblique view, many parameters of viewing and lighting must be set. For our cartographic configuration, we set the viewing plane of the oblique parallel projection parallel with the ground (Figure 3).
We fixed the horizontal viewing angle at 180˚ (towards north) due to the cartographic convention. The vertical viewing angle affects the visibility of height differences in the view; decreasing the angle exaggerates heights similarly to multiplying heights in the elevation model.
The literature recommends a vertical viewing angle of 45˚, but we found such an angle to be too large in this scene. According to number of trials for finding the optimal vertical viewing angle, we found an angle of 23˚ to be optimal, as it resulted in a small amount of occlusion without hiding too much of terrain.
Another important aspect of the rendering configuration is the set-up for the lighting of a scene. For the experiments, we used one infinitely distant light source and made rendering trials with different horizontal and vertical lighting angles.
The vertical lighting angle affected only the brightness of the view and the visibility of terrain details, whereas the horizontal lighting angle had more influence on the illustration of the terrain forms on the resulting image.
Literature on relief shading recommends placing a light source in the north-west direction. However, in oblique views the horizontal lighting angle should be set close to the horizontal viewing angle to prevent the over-representation of shadowed slopes.
The orientation of landforms in a scene may guide the choice of the angle, as in this case, where the hills of the area were directed from the north-east to south-west. We chose a light source from the orthogonal direction to the hills, that is to say, the south-east, because it depicted the landforms in the most illustrative way.
We chose the vertical lighting angle to be at 25˚ in order to highlight the finest details of the terrain (Figure 4).
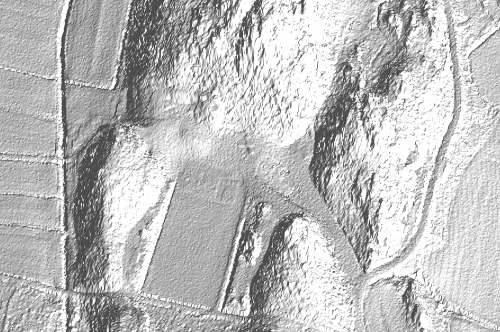
Further cartographic design of terrain portrayal
While Figure 4 gives an idea of the terrain relief in the scene, it is still somewhat difficult to estimate the elevation differences, directions and distances at ground level. We experimented with three cartographic elements in order to aid the interpretation: a hypsographic coloring, contours and a regular grid.
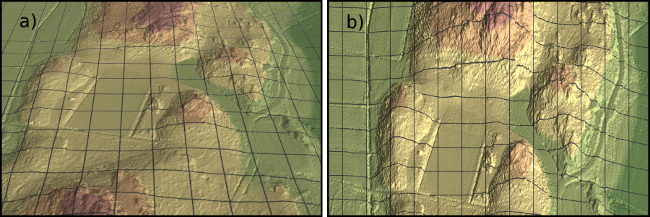
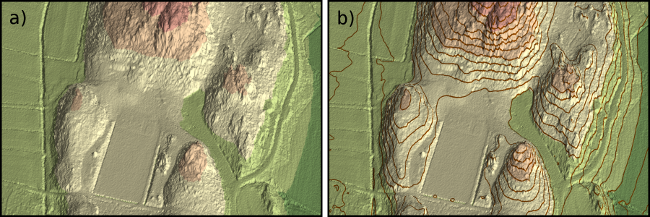
Hypsographic coloring is a color-coding method used for visualizing the height levels of the terrain (Imhof, 1982). It gives a map reader an immediate impression of the scene-wide height distribution and makes it easy to compare the elevations of distant locations. Hypsographic coloring can also provide a valuable depth cue for a 3D oblique view and prevent the visual fallacy of seeing relief inverted, which may occur due to the directed lighting. We used green-to-brown equal interval (10 m) hypsographic coloring, which resulted in five elevation classes in the test area (Figure 5a).
Hypsographic coloring can be complemented with contours that have a smaller height interval in order to provide a more detailed depiction of height levels (Figure 5b). The contours give additional information on terrain forms but also consume visual space in the image.
Square grids are commonly used in 2D maps to show the cardinal directions and co-ordinates on the map. The grid also supports the visual approximation of distances and surface areas. As already seen in Figure 2, a square grid draped on the ground surface can also be valuable in 3D oblique views. The grid becomes deformed due to the projection and still serves as a similar geo-reference frame, as on 2D maps.
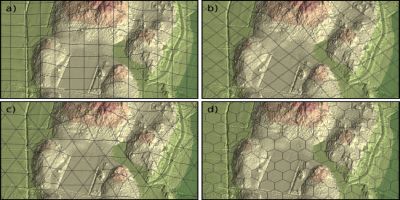
The square grid is simple to produce and easy to understand, but there are other regular grids that might be more useful in oblique views. Regular grids, in which all line segments have the same length and all angles between the segments are equal, are called equilateral and equiangular. In addition to the square grid, these include triangular and hexagonal grids. We rendered our parallel oblique view with all these grids and also with a square grid rotated by 45˚ (Figure 6).
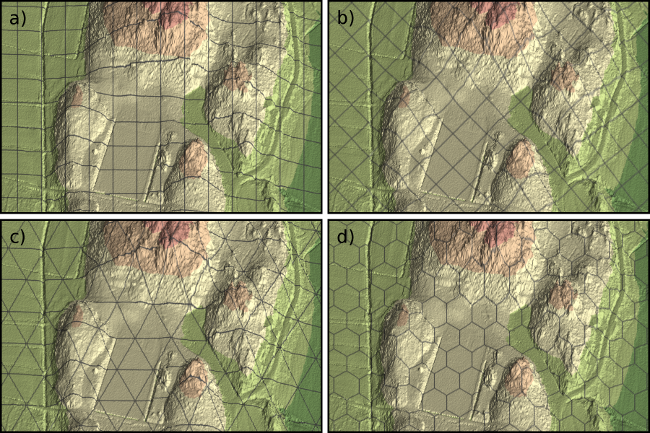
The regular grids in Figure 6 differ in their potential to visualize terrain relief and in their potential to provide support for estimating the distances and directions. In terms of visualizing the relief, the square grid (Figure 6a) has the redundant north-south lines which do not provide any information on the terrain elevations. The rotation of the square grid (Figure 6b) eliminates the redundancy but dismisses all cardinal directions.
The triangular grid (Figure 6c) has lines in one additional direction without the redundancy that is present in Figure 6a. The lines of the hexagonal grid (Figure 6d) are also in three directions, but the line segments form complex shapes without continuous lines. By this reasoning, we prefer the triangular grid for the relief visualisation and, as it turns out, the triangular grid seems preferable for the estimation of distances and directions as well: the lines extend over the whole view in three directions and intersect in a regular manner. It is simple to calculate path lengths by summing up consecutive line segments, as there are six directions present at each intersection.
Adding more cartographic elements
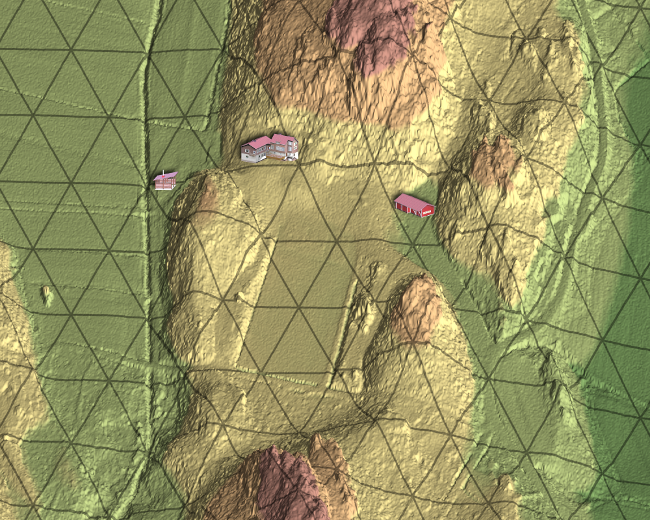
In order to enrich the cartographic representation and demonstrate the use of map symbols on top of the view, we included a few small-sized renderings of photorealistic building models created in Autodesk 3ds Max (Figure 7). While the landmarks increase the visual and cartographic value of the view, the appropriate use and rendering of cartographic symbology for maps in oblique parallel projection still needs further research.
Summary
Rendering 3D views in oblique parallel projection has advantages for cartographic use because of the scale-preserving properties of the projection:
A disadvantage of the oblique parallel projection is the same as that for any 3D oblique views: some terrain is occluded behind the back-facing slopes. Therefore, rendering of the images requires a careful design of the viewing angles, while taking into account the local characteristics of the topography. In dynamic digital maps the occlusion can be compensated for by a rotating view.
Our rendering experiments focused on visualizing terrain elevations, distances and directions in the oblique parallel projection. Further experiments will be directed towards enriching the view with cartographic contents and considering the use in dynamic map environments. User experiments are also planned in order to evaluate the usefulness of the oblique parallel projection.
————————————————————————————
Authors – Pyry Kettunen, Tapani Sarjakoski, L. Tiina Sarjakoski and Juha Oksanen
Finnish Geodetic Institute
Department of Geoinformatics and Cartography
FI-02431 Masala
Finland
e-mails: [email protected]
Acknowledgements
This survey is a part of two research projects. The MenoMaps -project is funded by Tekes (the Finnish Funding Agency for Technology and Innovation), and is a joint venture of the Finnish Geodetic Institute (FGI) and the Aalto University School of Art and Design. The UbiMap -project, Motive-program, is funded by the Academy of Finland and is carried out in co-operation with the FGI and the University of Helsinki, Cognitive Science.
References
Döllner, J., 2007. Non-Photorealistic 3D Geovisualization. In: Cartwright, W., Peterson, P. and G. Gartner (eds.), Multimedia Cartography, Springer, pp. 229–240.
Fontus Oy, 2007. Virtual Helsinki. Online: http://www.virtualhelsinki.fi (09/06/2010).
Häberling, C., Bär, H. and L. Hurni, 2008. Proposed Cartographic Design Principles for 3D Maps: A Contribution to an Extended Cartographic Theory. Cartographica, 43(3): 175–188.
Imhof, E., 1982. Cartographic relief presentation. Walter de Gruyter, Berlin. 389 p.
Jenny, B. and T. Patterson, 2007. Introducing Plan Oblique Relief. Cartographic Perspectives, Spring 2007 (57): 21–40.
Kettunen, P., Sarjakoski, T., Sarjakoski, L. T. and J. Oksanen, 2009. Cartographic Portrayal of Terrain in Oblique Parallel Projection. Proceedings of the 24th International Cartographic Conference, Nov 15-21, 2009, Santiago, Chile. Online: http://icaci.org/documents/ICC_proceedings/ICC2009/html/refer/20_10.pdf (09/06/2010).
Meng, L., 2007. Egocentric Design of Map-Based Mobile Services. Cartographic Journal, 42(1): 5–13.
Sarjakoski, T., Sarjakoski, L. T. and R. Kuittinen, 2007. Establishing a test environment for ubiquitous geospatial applications. Proceedings of 23rd International Cartographic Conference, Aug 4–10, 2007, Moscow, Russia. Online: http://icaci.org/documents/ICC_proceedings/ICC2007/documents/doc/THEME%2013/Oral%201/Establishing%20a%20Test%20Environment%20for%20Ubiquitous%20Geospatial%20Ap.doc (09/06/2010).
