As Hurricane Matthew developed into a Category 4 hurricane that pummeled the Caribbean and southeastern United States, killing more than 1,000 people, disrupting electricity and other utilities to hundreds of thousands, and causing billions of dollars in economic damage, many of the world’s satellites and sensors were tuned to the storm, and recorded its path and characteristics.
The following are several examples:
 instrument on NASA’s Aqua satellite produced this false-color infrared image of Matthew as the storm moved up Florida’s central coast. The image shows the temperature of Matthew’s cloud tops or the surface of Earth in cloud-free regions, with the most intense thunderstorms shown in purples and blues. (Credit: NASA/JPL-Caltech)")
On Oct. 6, NASA’s Atmospheric Infrared Sounder (AIRS) instrument on NASA’s Aqua satellite produced this false-color infrared image of Matthew as the storm moved up Florida’s central coast. The image shows the temperature of Matthew’s cloud tops or the surface of Earth in cloud-free regions, with the most intense thunderstorms shown in purples and blues. (Credit: NASA/JPL-Caltech)
, with cumulus and cumulonimbus clouds beneath (lower image). Reds/pinks are larger water/ice droplets. (Credit: NASA/JPL/The Cooperative Institute for Research in the Atmosphere, Colorado State University)")
NASA’s CloudSat flew east of Hurricane Matthew’s center on Oct. 6, intersecting parts of Matthew’s outer rain bands and revealing Matthew’s anvil clouds (thick cirrus cloud cover), with cumulus and cumulonimbus clouds beneath (lower image). Reds/pinks are larger water/ice droplets. (Credit: NASA/JPL/The Cooperative Institute for Research in the Atmosphere, Colorado State University)
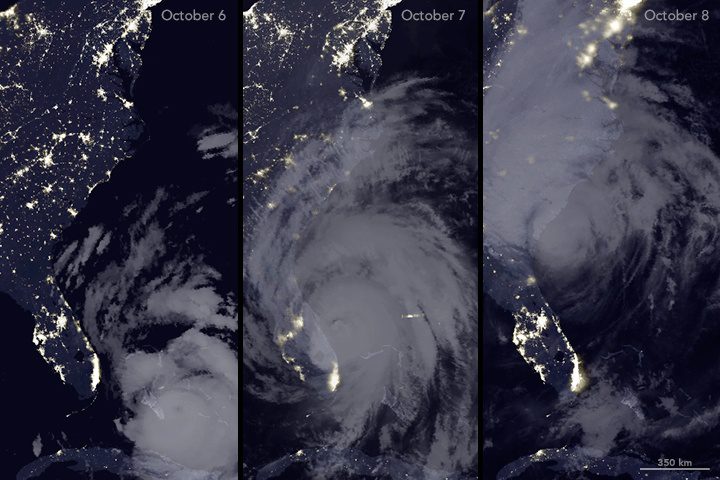
The Visible Infrared Imaging Radiometer Suite (VIIRS) on the Suomi NPP satellite captured three nighttime images of the Atlantic coast. The image on the left was acquired on Oct. 6; the middle image shows the same area on Oct. 7; and the image on the right was acquired on Oct. 8. (Credit: NASA Earth Observatory maps by Joshua Stevens, using VIIRS day-night band data from the Suomi National Polar-orbiting Partnership, data from the NASA-NOAA GOES project, and Unisys Weather.)
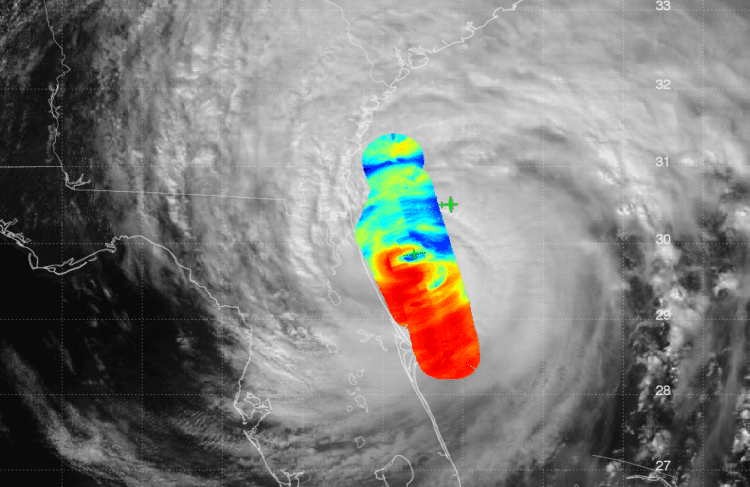
JPL’s HAMSR instrument flew above Hurricane Matthew on Oct. 7 aboard a NASA Global Hawk aircraft. Atmospheric temperatures are overlaid atop ground-based radar and satellite visible images (right), while a Global Hawk visible image is in the upper left. (Credit: NASA/JPL-Caltech HAMSR team/NOAA SHOUT Team/NASA Global Hawk Team)

Cameras outside the International Space Station and 250 miles overhead captured Hurricane Matthew on Oct. 7 as it was moving northwest through the Bahamas as a Category 4 hurricane. (Credit: NASA)
, processed by ESA)")
This image from the European Space Agency’s Copernicus Sentinel-3A satellite shows the temperature at the top of Hurricane Matthew on Oct. 7. The 400-kilometer-wide hurricane was about 200 kilometers northwest of Miami Beach when this image was taken. (Credit: Contains modified Copernicus Sentinel data (2016), processed by ESA)
")
On Oct. 8, NASA’s Aqua satellite captured this visible image of Hurricane Matthew’s clouds over the southeastern United States. (Credit: NASA Goddard MODIS Rapid Response Team)
")
This visible image of Hurricane Matthew along the southeastern U.S. coast was taken by NOAA’s GOES-East satellite on Oct. 8, 2016. (Credit: NASA/NOAA GOES Project)
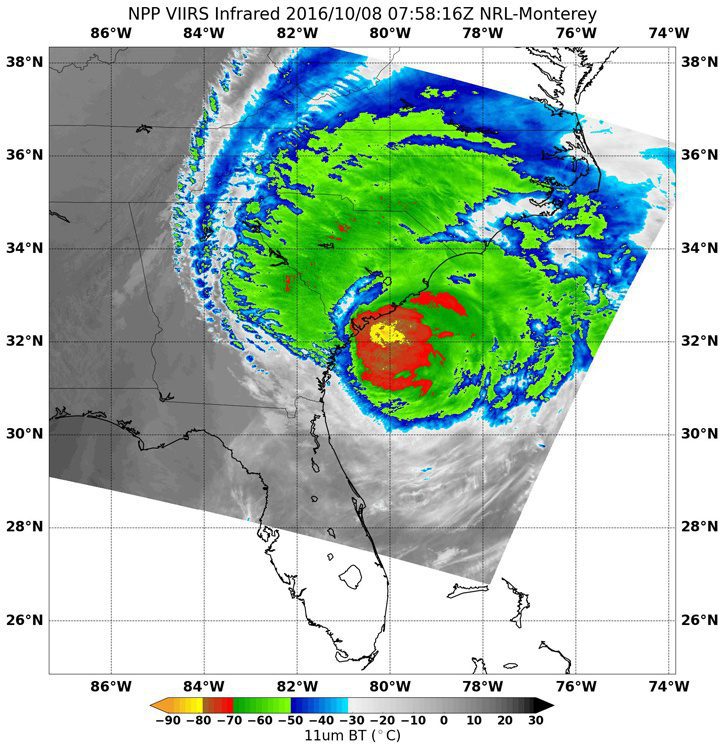
Also on Oct. 8, the VIIRS instrument aboard NASA-NOAA’s Suomi NPP satellite captured an infrared image that showed powerful storms around the eye with cloud top temperatures as cold as minus 80 degrees Fahrenheit (yellow). (Credit: NASA/NOAA/NRL)
