In recent years there has been acceleration in the collection and publishing of digital data about people, places, and phenomena of all kinds. Much of this big data explosion is due to the advancing diffusion of public data offered by government agencies at all levels. This increased availability of data presents great opportunities for answering new questions and improving understanding of the world by integrating previously distinct areas such as weather, transportation, and demographics, to name a few.
However, combining such diverse data remains a challenge because of the potential disparities in coverage, quality, compatibility, confidentiality, and update frequency, among others. Thus, developing strategies for handling such inconsistencies between datasets is critical for those interested in leveraging this abundance of data. It is also important for data providers, particularly in the public arena, to understand these challenges and the needs of integrators as they invest in the development new data dissemination approaches.
Combining multiple datasets into the same application or database for visualization and analysis has become common practice in nearly every industry today. This practice is typically done by centrally integrating existing public data from disparate sources that facilitates new analyses to be conducted more efficiently and at a lower cost. This practice has become particularly vital for those preparing for, monitoring, and responding to emergencies, natural hazard events, and disasters.
For government officials, emergency managers, the media, and others involved in what are often rapidly changing events, timely access to wide-ranging information is critical for effective decision making. For example, access to land elevation, evacuation routes, traffic conditions, weather forecasts, building and property data, hospital and shelter locations, addresses, population density, demographics, and more may be required. However, digital representations of such data generally have widely varying characteristics affecting their use and compatibility in an integrated environment.
To successfully assess data and make decisions about their use together in today’s complex geo-analytical applications, a holistic approach can be especially effective. By evaluating the analytical, operational, and organizational implications of data integration efforts prior to implementation, more effective integration strategies can be devised that can eliminate or reduce the many challenges inherent in this activity.

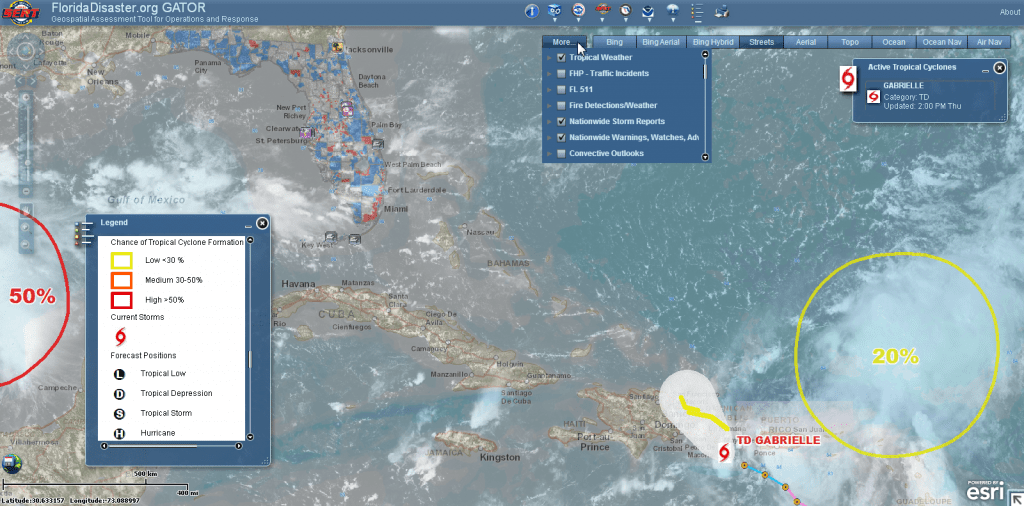
Florida’s Geospatial Assessment Tool for Operational Response (GATOR) brings together data from various sources to aid preparedness and response.
Before data can be integrated for analytical purposes, there are several important questions that should be considered: What is the intended purpose of integration? Does integrating data help solve a new problem or answer a specific question? Does data cover the same geographic area and scale? Will datasets interact with one another? Are there complex geographies or special cases that may present problems?
Combining digital data for spatial and geographic analyses, presents a variety of challenges that need to be addressed. Consideration should be given to any facet of incoming data that may affect analyses including:
The two maps displayed in figures 1 and 2 demonstrate the importance of scale when integrating geospatial data to determine the impact from natural disasters. Figure 1 shows a map developed to estimate the number of people affected by hurricane Sandy by combining data representing the high wind impact area at the time of landfall (the large oval area outlined in orange) with Census population figures by tract (in blue). Because there are many tracts entirely within the wind area, a standard spatial containment query enables the retrieval of population totals limited to the area in question, yielding an accurate result.

Figure 1. Map shows Census tracts in blue falling mostly all within hurricane Sandy wind area (in orange outline) during landfall on October 29 2012 (from Census OnTheMap for Emergency Management tool at: http://onthemap.ces.census.gov/em.html).

Figure 2. Map shows Census tracts in orange extending mostly outside of tornado impact area (outlined in red) in Moore Oklahoma (from ArcGIS Online web map at http://bit.ly/1atvA04).
In addition to analytical aspects, there are a variety of practical operational factors that may affect the technical implementation of integration efforts. Operational considerations can help answer questions such as: How is data accessed and stored? What formats and data models are used? Are data processing steps required? How often is data updated or changed? Operational Considerations include :
Operational aspects are particularly central to real-time applications that rely on continuous access to data that’s always changing. When integrating data from disparate external sources, special accommodation and testing may be required to anticipate and minimize unforeseen issues due to content and formatting changes over time. For example, atypical geographic features or shapes may be encountered, schemas can change, and data services can slow down or become inactive without warning.
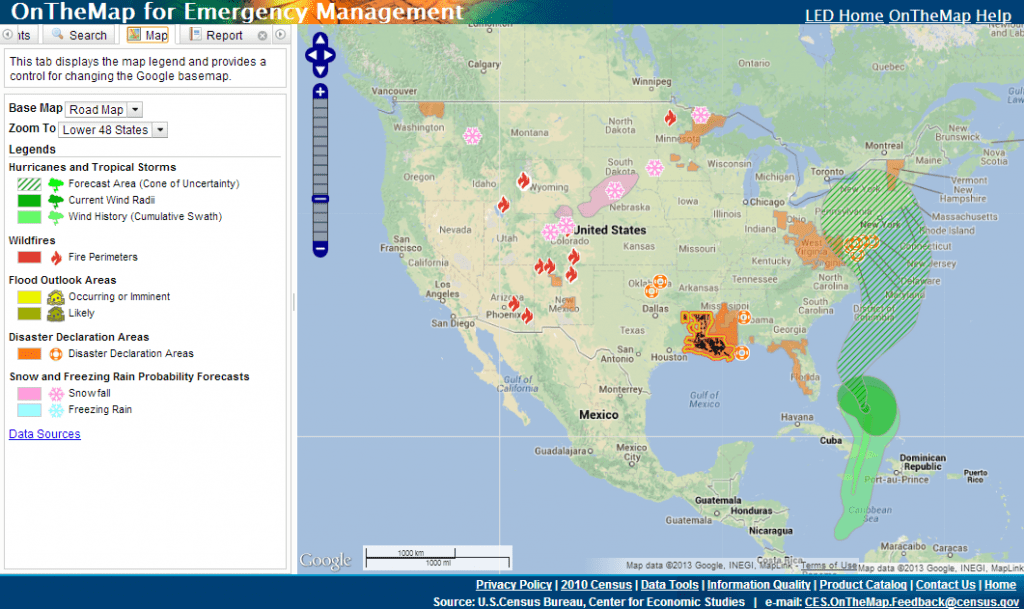
Figure 3 shows an example of a U.S. Census Bureau application, designed for studying the potential impacts of disaster events, that integrates a variety of natural hazard and socio-economic data from various federal sources with varying update frequencies. Here, National Weather Service data on floods and winter storms are updated on a daily cycle, hurricanes and tropical storms data are released on a regular hourly-based schedule, while USGS wildfire data and disaster declaration data from FEMA are updated on an ongoing as-needed basis. Census statistics on the U.S. workforce and population are updated on annual and decennial timetables.

Figure 3. Shows screenshot of U.S. Census Bureau’s web-based OnTheMap for Emergency Management tool (available at http://onthemap.ces.census.gov/em.html) which integrates diverse natural hazard and socio-economic data for studying potential disaster impacts.
In addition to analytical and operational aspects, organizational or environmental factors can also greatly influence many data integration decisions. For example, many governmental organizations have policies, procedures, and protocols which may need to be followed that direct how internal and external data and systems can be accessed or integrated. These might include standard operating procedures, change control steps, security protocols, quality assurance measures, and other administrative requirements.
Consideration of the costs associated with data integration is also important to any organization involved in evaluating this activity. Given the complexity of many modern integrated environments which merge internal and external data that is constantly changing, calculating and allocating costs can be challenging. Several important questions to consider include : Are there data licensing fees? Is new hardware or software required? Will new skills be required to implement and sustain data integration activities? What is the management and maintenance cost over time as databases evolve and grow?
Given the diversity of factors that influence successful geospatial integration, developing a comprehensive approach that considers the analytical, operational and organizational implications can be helpful to integrators and suppliers alike. Business tools such as decision trees, flow diagrams, and simple graphic mockups can help solidify project goals and illuminate potential pitfalls before diving in. Utilizing or establishing basic data standards can also provide a basis for ensuring analytical, operational, and organizational consistency across integration efforts over time. In-depth testing and evaluation is, of course, often the best way to uncover the particular challenges inherent in any data integration project.
Government agencies play an increasingly important role in making data available to the public that is easy to utilize and integrate. As more of this data becomes available and the efficiencies of integration further realized, understanding how to evaluate and manage this activity is likely to become even more important.
About the Author
Robert Pitts is Director of Geospatial Services at New Light Technologies Inc. in Washington D.C., overseeing the provisioning of technical consultants and delivery of information solutions for a variety of government and commercial clients. Robert received his Master’s degree in Geographic Information Science from Edinburgh University (UK) and a Bachelor’s degree in Geography from the University of Denver. Robert is also a Certified Geographic Information Systems Professional (GISP) and Project Management Professional (PMP).