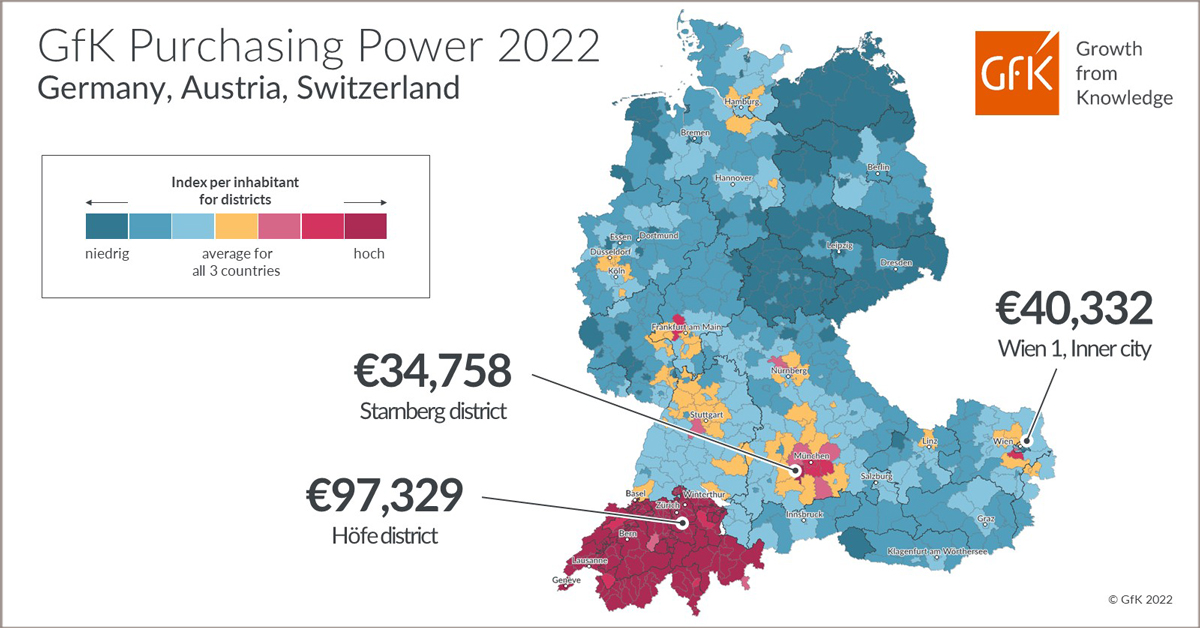
GfK’s Map of the Month for April shows the regional distribution of purchasing power in Germany, Austria and Switzerland in 2022.
With an average per capita purchasing power of €41,758, the Swiss will once again have significantly more money available for spending and saving in 2022 than the neighboring Germans (€24,807) and Austrians (€24,759). However, there are significant regional differences in terms of net disposable income not only between the three countries but also within each country.
In Switzerland, the district of Höfe takes first place by far. People there have an average of €97,329 at their disposal, well over 3 times the purchasing power of the Bernina region, which has the lowest purchasing power (€30,608). Among Austrians, Vienna’s first district (inner city) leads the way with a per capita purchasing power of €40,332, while Vienna’s 15th district (Rudolfsheim-Fünfhaus) brings up the rear with €19,587. The purchasing power gap widens least in Germany: with a per capita purchasing power of €34,758, the Starnberg district leads the ranking of German districts; Gelsenkirchen comes last with a net disposable income of €19,778 per inhabitant.


Download the map in high-resolution JPG format…
The map may be freely distributed and reproduced if the following attribution is included: “Illustration: GfK”.
Further insights into GfK’s market data offering can be found here.