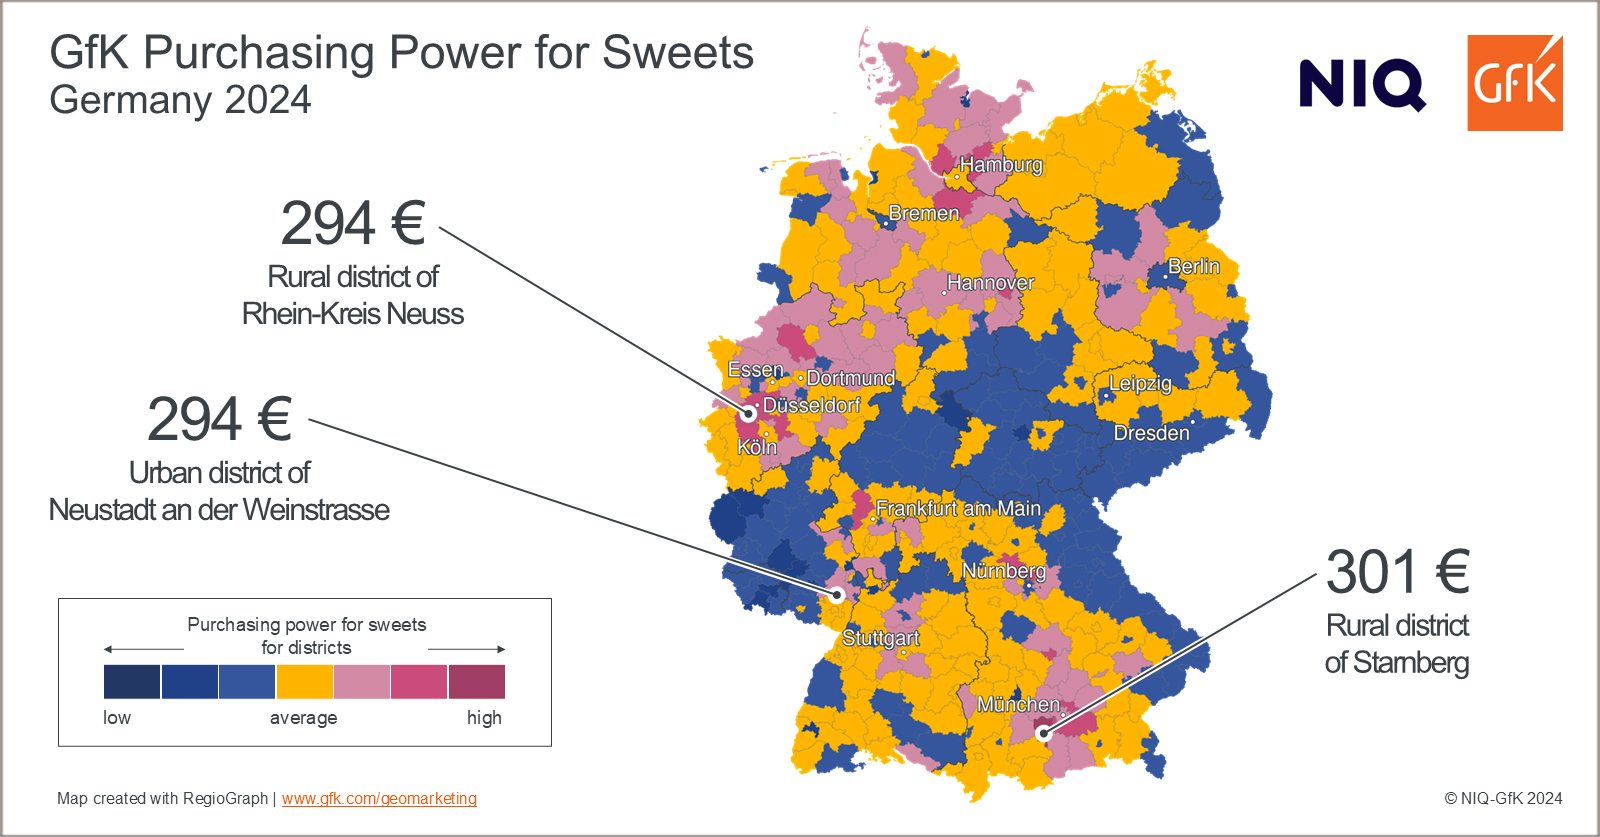
Our Geomarketing Map of the Month for December shows the regional distribution of purchasing power for sweets in Germany in 2024.
In 2024, every German spends an average of 245 euros on sweets, and with that more than on any other food group. However, the spending potential varies considerably depending on the region. With a per capita purchasing power of 301 euros, the Starnberg district takes first place, putting the Starnbergers almost 23 percent above the national average. In second and third place are the urban district of Neustadt an der Weinstrasse and the Rhein-Kreis Neuss district, each with 294 euros per capita and 20 percent more available spending potential than the average German. Bringing up the rear is the urban district of Gelsenkirchen, where residents only have 203 euros per person available for sweets. This corresponds to 83 percent of the German average.
Download the map in high-resolution JPG format…
The map may be freely distributed and reproduced if the following attribution is included: “Illustration: NIQ-GfK”.
Further insights into NIQ-GfK’s market data offering can be found here.
