
GOLDEN, Colorado, 19 August 2026 – Golden Software, a leading developer of mapping, plotting, and visualization software, has upgraded the visualization functionality in the newest version of its Grapher scientific graphing package for easier communication of complex data sets. In addition, Golden has continued to expand the online Template gallery experience that was re-introduced in the previous version.
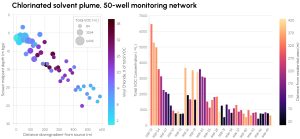
Grapher’s new Bubble Fill by Colormap shows four variables in one plot: distance downgradient, well depth, total VOC concentration by bubble size, and vinyl chloride share by color. Bar Chart Fill by Colormap adds a second variable to the bar chart, coloring each well by its distance from the nearest residential area.
Grapher is used extensively by scientists and engineers to make better decisions by visualizing and communicating complex data sets in ways that simply can’t be accomplished with spreadsheets. The Grapher motto is, “If you can imagine it, you can graph it.”
Relied upon by users in environmental services and consulting, climate research, energy/mineral exploration, and academic pursuits, Grapher offers deeper insights into diverse data sets, including chemical, physical, geologic, and geospatial data, through 80 different 2D and 3D plotting types. Grapher is often used to plot data captured by a variety of chemical and physical sensors in the field.
“In the latest Grapher, we have focused on making it easier for users to communicate insights by showing multiple variables and their interactions in a single plot,” said Ruth Rodman, Grapher Product Manager. “Based on the positive reaction from the recent Template upgrade, we have added several Templates to the gallery that will streamline data preparation, analysis, and visualization for both new and long-time users.”
The newest release of Grapher, which is downloadable now to all users with active maintenance or subscription agreements, includes these enhancements:
Bubble Fill by Colormap
Users can visualize their data more fully by representing four different variables in one bubble chart – an entirely new way of presenting multivariate data. As always, two variables can be plotted with X and Y axis while another value can be represented by the size of a bubble on the plot with a fourth shown by bubble color. Numeric data values can now be defined by color gradients in the bubbles.
Bar Chart Fill by Colormap
Grapher now adds a new dimension to data analysis with bar charts. In addition to representing a data value by the height of the bar, another variable can be shown by color. For example, the magnitude and hazard risk of volatile organic compound concentrations across monitoring wells can be presented by bar size and color in a single chart.
Snap Shapes while Drawing
Building on the existing capability of allowing users to draw polylines and polygon to annotate elements on their plots, Grapher now snaps those mouse-drawn shapes to the relevant feature or point. This enables users to precisely highlight axes, tick marks, data points, and boundaries without the viewer needing to zoom or guess which object is annotated.
Legend Improvements
Plot legends have been improved in several ways to make presentations cleaner and more concise. Among the most useful is the ability to delete empty classes from the legend, a major timesaver for users who repeatedly utilize standard class templates across multiple databases. The inevitable empty classes can be hidden with a single mouse click to declutter reports. Additionally, Grapher now automatically generates a multi-color swatch legend from your plot for easier viewing and interpretation of charts.
Import and Export AutoCAD Drawing Files
Grapher can import and export AutoCAD DWG Drawing Files as well as DXF files. Golden Software introduced this feature last year in its Surfer surface mapping package and now added it to Grapher to enhance the compatibility between the two software products for ease of CAD file exchange.
Help Ribbon
A unified Help Ribbon Page has been added to Grapher so users can quickly and easily get Help checking for updates, contacting technical support, or digging deeper into the Help system without searching through multiple tabs.
More Templates in the Online Gallery
The response to the expanded and reimagined Templates functionality highlighted in the previous Grapher has exceeded expectations. As a result, Golden has added a variety of new graphing and plotting templates in the online Gallery where users can browse and see new ways to present their data sets. Anyone can visit the Golden Template Gallery online at https://gallery.goldensoftware.com.
The next Beta cycle for the Golden Software Grapher package is now open. As always, users are invited to send their ideas for new or updated features and capabilities. Send an email to [email protected] with your suggestions.
About Golden Software
Founded in 1983, Golden Software is a leading developer of scientific visualization software at a great value. Its customer base includes over 100,000 professionals involved in environmental services, engineering consulting, resource exploration and extraction, applied science, business, education, and government in nearly 190 countries and territories. Golden Software offers two products: Surfer® for gridding, mapping & 3D visualization system and Grapher™ for 2D and 3D graphing. Golden Software offers its clients personalized support invested in their success.
For additional information, visit www.GoldenSoftware.com or call 1-303-279-1021.
