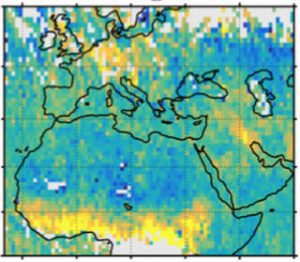
A map shows human carbon dioxide emissions over Europe, the Middle East and northern Africa. High emissions over Germany and Poland (top center) and Kuwait and Iraq (right) mostly come from burning fossil fuels, but over sub-Saharan Africa, they mostly come from fires. (Credit: FMI)
Scientists produced the first global maps of human emissions of carbon dioxide ever made solely from satellite observations. The maps, based on data from NASA’s Orbiting Carbon Observatory-2 (OCO-2) satellite and generated with a new data-processing technique, agree well with inventories of known carbon dioxide emissions.
No satellite before OCO-2 was capable of measuring carbon dioxide in fine-enough detail to allow researchers to create maps of human emissions from satellite data alone. Instead, earlier maps incorporated estimates from economic data and modeling results.
However, a team of scientists from the Finnish Meteorological Institute, Helsinki, produced three main maps from OCO-2 data, each centered on one of Earth’s highest-emitting regions: the eastern United States, central Europe and East Asia. The maps show widespread carbon dioxide across major urban areas and smaller pockets of high emissions.
“OCO-2 can even detect smaller, isolated emitting areas like individual cities,” said research scientist Janne Hakkarainen, who led the study. “It’s a very powerful tool that gives new insight.”
