 After intense fires in the Amazon captured global attention in 2019, fires again raged throughout the region in 2020. According to an analysis of satellite data from NASA’s Amazon dashboard, the 2020 fire season was actually more severe by some key measures.
The Visible Infrared Imaging Radiometer Suite (VIIRS) sensors on the Suomi NPP and NOAA-20 satellites can detect thermal anomalies, or hot spots, caused by fires. In 2020, both VIIRS sensors combined detected about 1.4 million anomalies in the southern Amazon, compared to 1.1 million in 2019.
“Fire activity was up significantly in 2020. All types of fires contributed to the increase, including deforestation fires and understory fires, the most environmentally destructive types,” said Douglas Morton, chief of the Biospheric Sciences Laboratory at NASA’s Goddard Space Flight Center. “In the southern Brazilian Amazon, deforestation fire activity increased by 23 percent from 2019 to 2020, and active fire detections from understory fires were 60 percent higher than in 2019.”
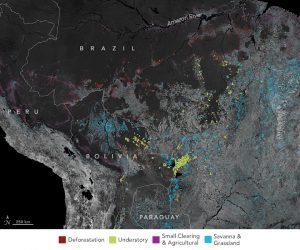
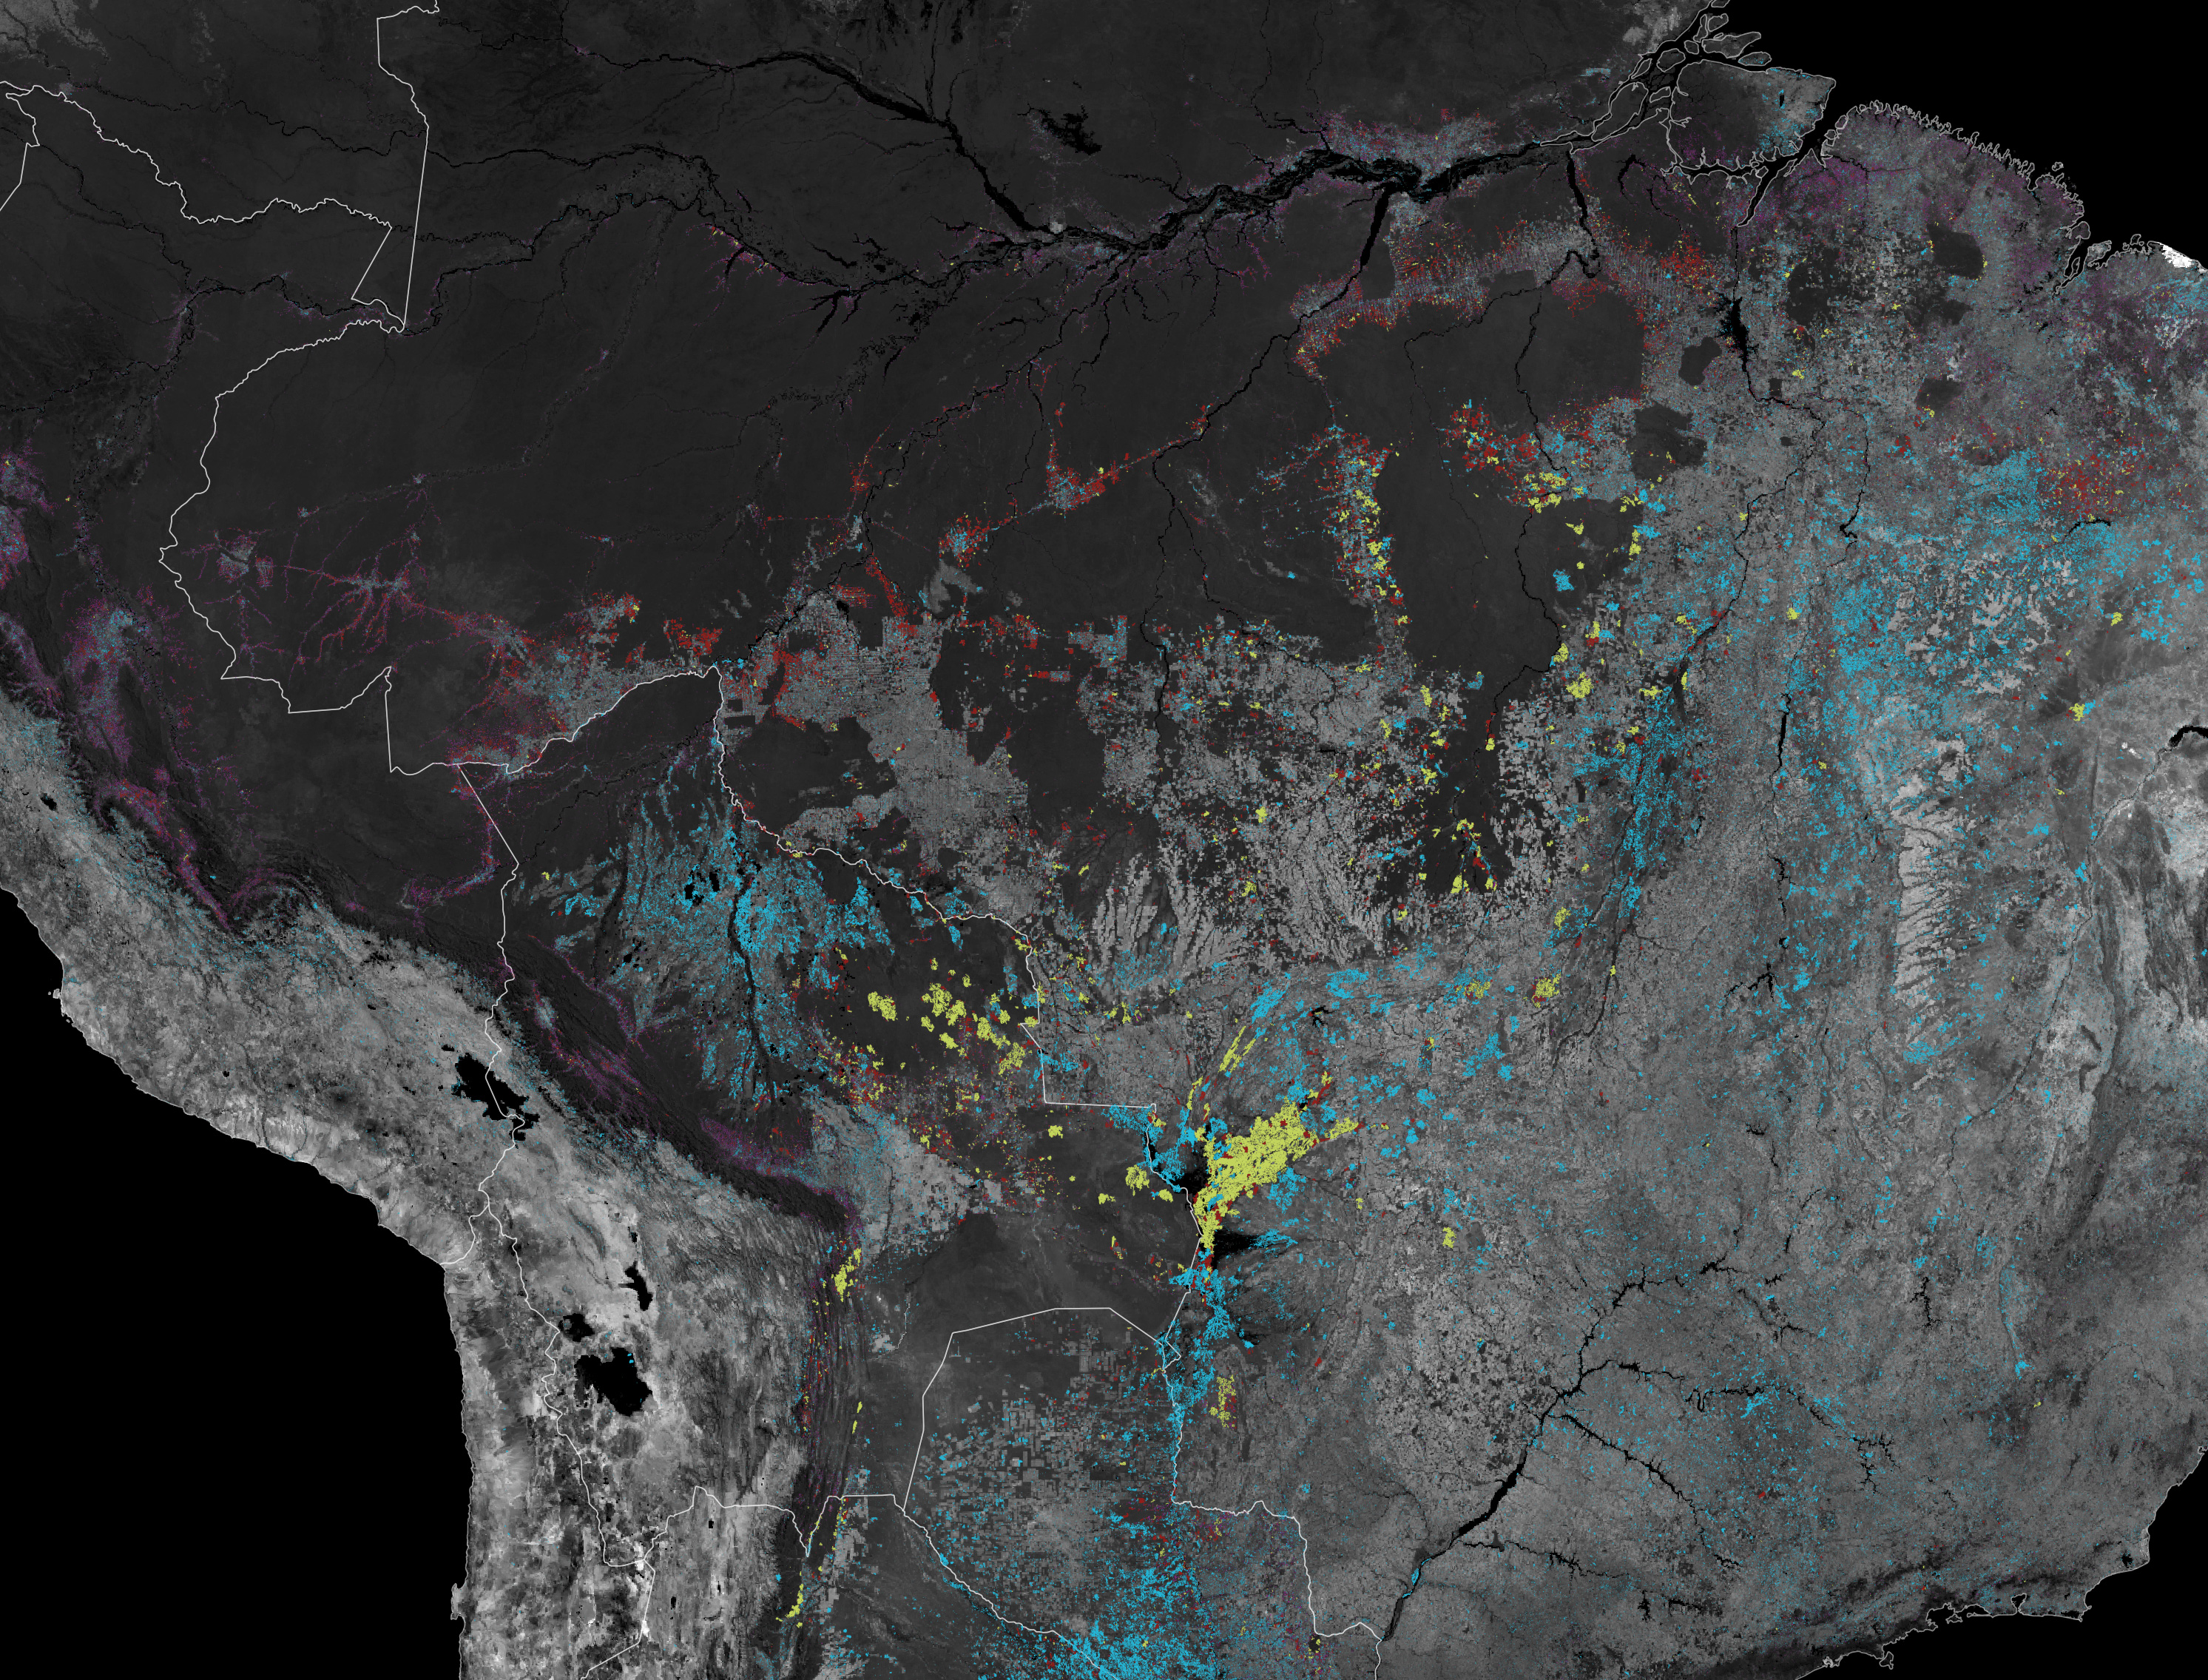
Morton and colleagues developed a new tool that groups and sorts fires into four types: deforestation (red in the accompanying map), understory forest fire (green), savanna-grassland (blue) and small clearing-agricultural (purple). Download a full-resolution view of the map here. The tool uses characteristics such as the duration, intensity, and movement of fire anomalies to group and identify individual fire events. A single fire event can include dozens or even hundreds of connected thermal anomalies spread out over days or weeks.
Image Credit: NASA Earth Observatory maps by Lauren Dauphin, using data from the GFED Amazon Dashboard team. VIIRS fire data from NASA EOSDIS LANCE, GIBS/Worldview, and the Suomi National Polar-orbiting Partnership. Landsat data from the U.S. Geological Survey. Indigenous Territories and Natural Protected Areas data from the Amazon Geo-Referenced Socio-Environmental Information Network (RAISG).
