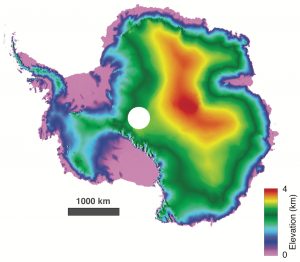
 Ice is a hot topic when it comes to understanding and monitoring how this fragile component of the Earth system is being affected by climate change. Scientists go to great lengths to study changes happening in the remote icy reaches of our planet–a subject that is being discussed in detail at the Living Planet Symposium in Italy. Among the results being presented is a novel 3D dataset of Antarctica. Scientists from the University of Edinburgh, UK, created this new view by processing data from ESA’s CryoSat in a clever way.
CryoSat carries a radar altimeter that measures the height of the world’s ice. Typically, the data are used to map the height of ice at single points. And since it was launched in 2010, this has revealed much about how ice sheets, glaciers and sea ice are changing.
Nevertheless, a technique called “swath processing” takes the data to a new level. Scientists have used CryoSat’s novel “interferometric mode” to produce whole swaths of data and in much finer detail and faster than is gained by conventional radar altimetry. The usual spatial resolution of a few kilometers has been improved to less than one kilometer.
The technique is allowing scientists to better understand change and predict how ice sheets, glaciers and ice caps may behave as climate change takes a stronger grip. This is important with respect to global concerns such as sea-level rise.
The team used this method to map Greenland in 2017, and now the Antarctica model is available. Both datasets can be downloaded from the CryoTop website.
Credit: University of Edinburgh
