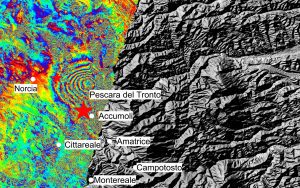
Seven interferometric “fringes” correspond to about 20 centimeters of surface deformation in the radar sensor line of sight. Each fringe (which is associated to a color cycle) corresponds to approximately 2.8 centimeters of displacement. (Credit: Contains modified Copernicus Sentinel data (2016)/ESA/ CNR-IREA)
A 6.2 magnitude earthquake struck central Italy on Aug. 24, 2016. Approximately 300 people died as a result of the quake, which devastated several towns in the country’s Apennine mountain belt.
The Italian peninsula features fault lines created by the separation of the African and Eurasian tectonic plates. The fault line separating these two plates runs below the central Apennine mountains and along Italy’s Adriatic coast.
The European Space Agency Sentinel satellites recorded before (on Aug. 20 by Sentinel-1B) and after (on Aug. 26 by Sentinel-1A) radar scans of the area, and a combined interferogram shows the land’s displacement. Although Sentinel-1 has a swath width of 250 kilometers over land surfaces, its pass over Italy on Aug. 26 didn’t cover the entire area affected.