As part of the effort to respond to the needs of the most vulnerable and impacted groups during the ongoing and rapidly developing coronavirus pandemic we’ve developed a series of maps that identify regions throughout California that may be in most need of resources and support. The maps serve as tools to assist aid organizations and nonprofits working on the ground to reach particular groups, government agencies working on plans to allocate resources, health organizations, and the media. Visit each set of maps by clicking on the thumbnail images below.
K-12 students using free or reduced-price meals
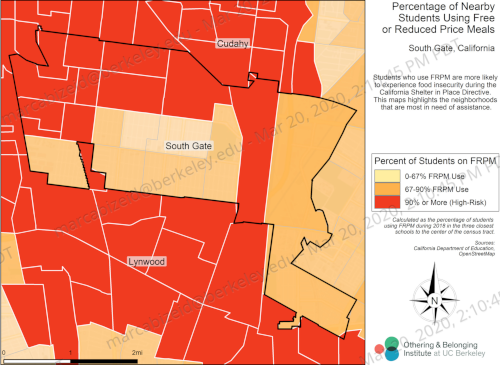 Kindergarten through Grade 12 students who benefit from free or reduced-price meals are more likely to experience food insecurity during the California Shelter in Place Directive. This set of maps highlights the neighborhoods that are most in need of assistance.
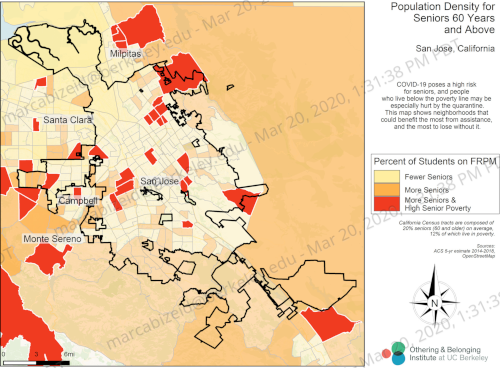 COVID-19 poses a high risk for seniors, while people who live below the poverty line may be especially hurt by the quarantine. This set of maps show neighborhoods in California that could benefit the most from assistance.
Hospital beds per capita by county
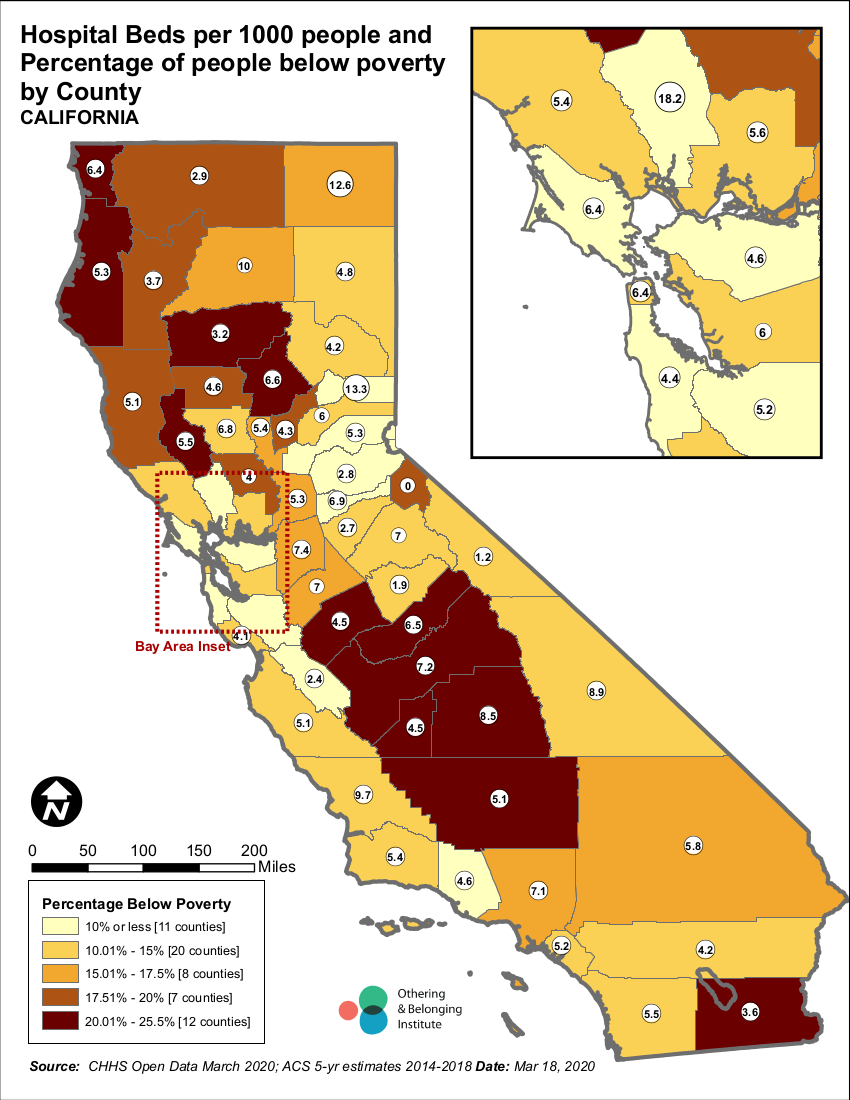
This set of maps shows the number of hospital beds per 1,000 people located in each county in California, as well as the percentage of people from different racial groups and elderly people living in poverty in those counties.
