 Urban planning can achieve many gains through closer connection to the remote sensing community and use of modern remote sensing technologies. While some projects, such as the European Urban Atlas extensively use remotely sensed data, the gradual commercialization of satellite or airborne earth observation since the 1970s and its prospects on performance and effectiveness have greatly expanded.
Earlier predictions on uptake and use were probably far too optimistic. This led to some disappoints where projects were not realised. In consequence, remote sensing data and products often played, at least in Germany, a secondary role. Today urban planners confirm that remotely sensed data and derived products are only used rudimentarily in their daily routine [1]. For this reason it is important to demonstrate the value of today’s earth observation technologies for urban planning.
Planning is a highly complex process aiming at a conceptual anticipation of future situations. Thus it needs a responsible balancing of advantages and disadvantages from a holistic perspective. The most important condition for the balancing of pro’s and con’s and a subsequent development of strategic orientation for future planning activities is knowledge: knowledge on the inhabitants of the city and the physical urban environment as well as change over time.
These changes can impact urban climate, traffic, social and economic considerations. These questions are inherently spatial in nature. In the best case manifold spatial and quantitative information are available to form opinions and support subsequent decision-making. But relevant data sets are often limited at hand or even inaccessible, because they are too expensive, outdated, generalized or restricted due to data security, among other reasons.
Earth observation is an independent data source. Since the launch of the internet platform “Google Earth”, earth observation data became more or less common knowledge. On the one hand the theoretical possibility to obtain spatial information globally on objects, structures or patterns of the land surface allows unimagined information and possibilities.
Meanwhile, the development of sensors with a spatial resolution of one meter and better allows the specific requirements of small-scale and complex city landscapes to be met. On the other hand timeliness of the data on these platforms and their volume, often leave users with an amorphous ocean of buildings in a mega city, when their needs are more direct and dependent upon quantified and objective information needed for the planning process
Therefore this paper addresses several specific questions on the value of remote sensing to urban planning:
Which remotely sensed data sets are useful for urban areas?
What are the capabilities and limitations of remote sensing regarding mapping, subsequent analysis and indirect assessments for relevant products to urban planning?
Remote Sensing and Urban Planning – a common future?
The Value of Remote Sensing to Urban Planning
a) Remotely sensed data sets
The capabilities of various sensors reach far beyond the obvious benefits available at platforms like Google Earth or Bing. They provide reflective responses all along the electromagnetic spectrum which enables detection of objects or patterns of the earth’s surface and their condition [2]: The sensors cover many spatio-temporal dimensions, with a flexible repetition rate and in various scales ranging from spatially detailed analysis on single buildings or building block level to global studies on continental scale.
In combination with widely automated methods of data processing and image analysis, urban remote sensing provides multiple options to support decision makers such as resource managers, planners, environmentalists, economists, ecologists and politicians with accurate and up-to-date geoinformation. Thus, information may be tailored for individual and organisational use.
Available space-borne systems provide data sets with low spatial resolution (in the range of > 500m) and a broad swath (spatial coverage of one image). Thus, sensors like DMSP-OLS (night-time lights), MODIS or NOAA enable mapping on continental or national basis. On medium spatial resolution (>5m) sensors like Landsat, SPOT, IRS or RapidEye featuring a field of view of 60-185 km enable to separate urbanized from non-urbanized areas on a regional scale.
Highest geometric resolution (<5m) provide sensors like Ikonos, Quickbird, Cartosat-2 or WorldView I & II allowing the classification of the small-scale individual objects typical for cities. The restriction here is that the swath of around 15 km often does not cover the full extent of urban-suburban areas.
Also, radar sensors such as TerraSAR-X, CosmoSkyMed, RADARSAT or ALOS are operating from space. These active systems are weather-independent (all-time) systems, while the optical systems are restricted to cloud free skies. With spatial resolutions up to 1 meter these data sets are capable of detecting the small-scale structures of cities as well, with swaths from 10 to 100 km.
In addition, interferometric SAR has been applied widely to derive digital elevation models (DEMs). In particular, the Shuttle Radar Topography Mission (SRTM) of the year 2000 supports urban analysis with area-wide DEMs with a spatial resolution of up to 30m. The German TanDEM-X will provide from 2012 on a global DEM with a spatial resolution of 10-12m.
Next to satellite based sensors, airborne remote sensing provides complementary data sets especially suitable for cities: Hyperspectral sensors such as HyMap enable the mapping of surface materials or the condition of vegetation, aerial imagery provides spatial resolutions up to few centimetres and laserscanning as well as stereo cameras enable producing digital surface models on geometric resolutions of 1 meter or even higher, for example.
(b) Mapping
The images presented above are data not information. The strength of remote sensing with its synoptic overview allows independent, fast, up-to-date, area-wide and relatively cost-effective transformation of data (or images) into information. Making use of a vast amount of methodologies – e.g. statistical-, neural-, fuzzy classifiers – for automatic information extraction for particular data sets this transformation leads to application-driven products.
With this the basic question on “what” is “where” within the urban environment can be answered: The main field of application is mapping the urban environment providing an inventory of the urban morphology. Depending on available data sets, products vary from urban footprint level (Fig. 3) to a spatial level where individual objects are identified.
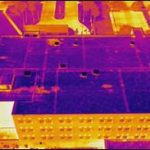
As example, multi-sensoral data processing of high resolution optical satellite data in combination with a high resolution airborne digital surface model allows the derivation of a 3D city model (Fig. 1a). This is e.g. relevant for identification and quantification of the building stock, vegetation fraction, infrastructure, or undeveloped areas.
Furthermore, the combination of the 3D city model with hyperspectral remotely sensed data allows the retrieval of information on the materials of the surfaces [2]. Thus, roof materials, asphalt types, vegetation types and condition, etc. can be identified and quantified. Typical applications include the detection and quantification of existing solar panels, green roofs or the identification of roofs suitable for this usage.
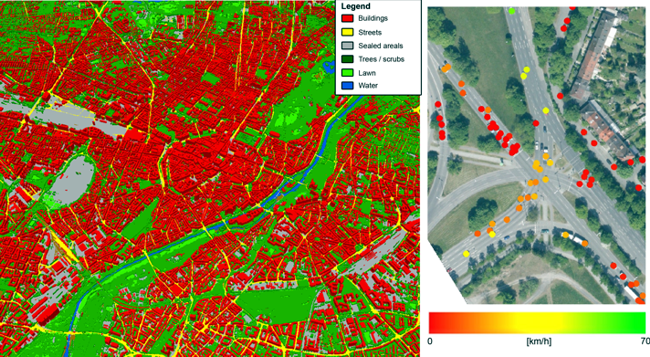
A city is not only a conglomeration of buildings and streets. The people living there, their mobility turn the physical urban scenery into a lively system. Beyond mapping the physical appearance of a city remote sensing allows also to capture mobility. Especially airborne remote sensing systems enable the necessary short time intervals for data acquisitions to monitor traffic flows.
Thus, it becomes possible to detect traffic situations or to monitor parking areas in near real time (Fig. 1b) [3]. Using these algorithms it even becomes possible to detect people or crowds and their trajectories and movements, which is a crucial application in the field of risk management and emergency coordination [4].
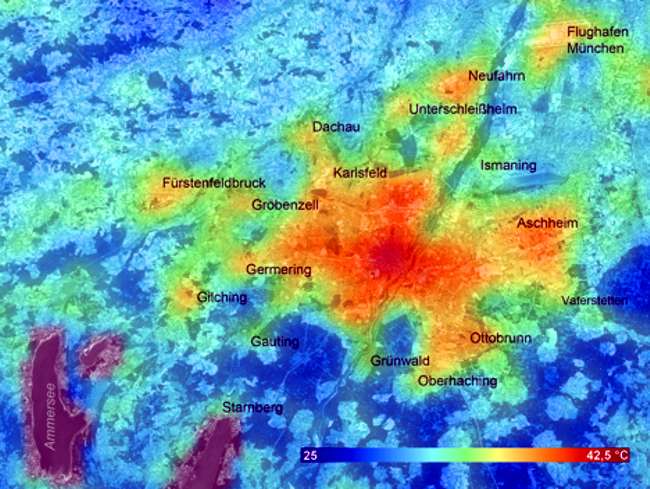
Next to the use of optical remotely sensed data thermal infrared bands of e. g. NOAA-AVHRR data in combination with the NDVI, which is an indicator for emissivity, allow to retrieve land surface temperature (LST) [6]. Figure 2 shows the derived LST for the suburbia of Munich measured on the 29th of July in 2009 on regional scale. It becomes obvious that the LST in the urbanized area of Munich and its suburbs is significantly higher than its rural surroundings [7].
(c) Analysis
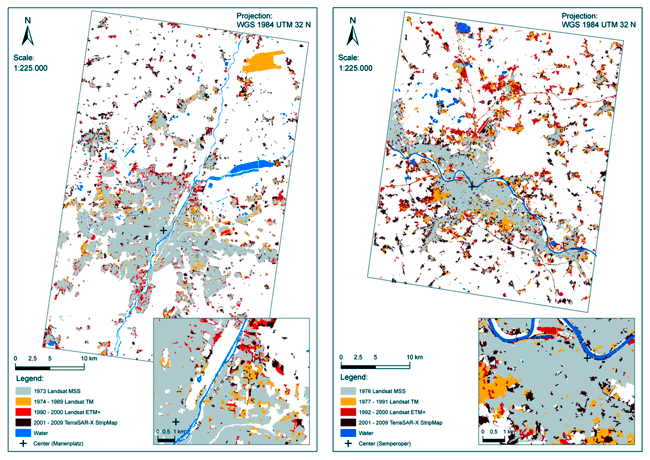
Beyond the various capabilities of mapping the city remotely sensed data sets can be used for analysis: Multi-temporal remote sensing facilitates the monitoring of spatial urbanization over long as well as short time periods. Using satellite systems like Landsat, available since 1972, monitoring spatial urban growth becomes possible for almost 40 years. Change detection from 1973 until 2009 in 4 time intervals shows spatial urbanization for the cities of Munich and Dresden and their surroundings (Fig. 3).
Using methods like gradient analysis or landscape metrics, the spatial extent, its landscape configuration, direction of growth, etc. can be quantified and used to compare cities to each other [8]. Regarding shorter time intervals detection or monitoring of changes, like e. g. at construction areas or building collapses after an earthquake impact (www.zki.dlr.de) are valuable applications [9].
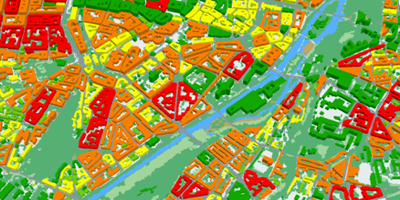
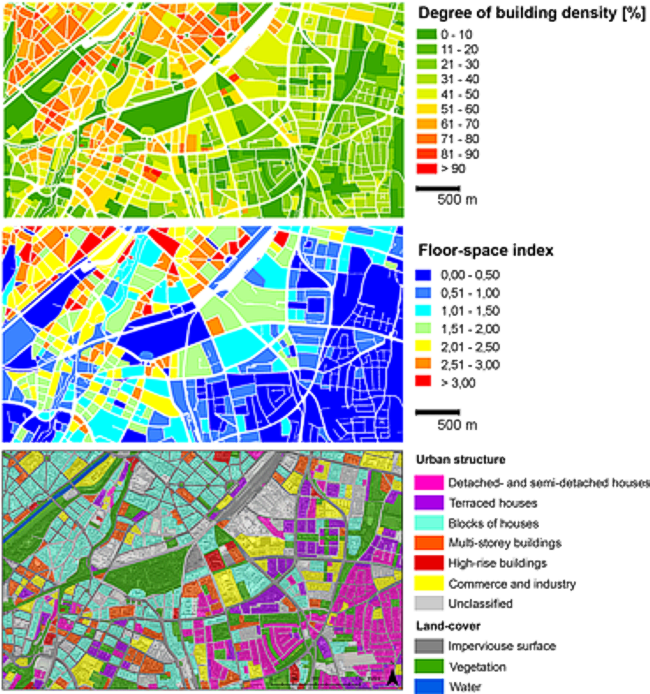
Using the 3D city model spatial analysis on a higher geometric resolution is possible. Different spatial references, e.g. administrative units, blocks, the street network or artificial units like rings or sectors enable the calculation of physical parameters describing and quantifying the urban structure: examples are building density, floor-space index, percentage of impervious surfaces, vegetation fraction or dominant roof materials [10].
Figure 4 shows two exemplary parameters calculated for the reference unit “block” defined by the street network. In addition, the physical knowledge on block level in combination with physical parameters on building level, like building size, height, alignment, etc. allows the derivation of urban structure types, e. g. perimeter block development, detached houses or high-rise buildings. These spatial parameters support regional and urban planning with objective and quantitative information on the urban morphology. Compared the percentage of impervious surfaces per county and per inhabitant per county for the complete area of Germany [11]. (Sentence incorrect?)
The availability of these products on urban morphology is of crucial importance in the field of risk and vulnerability assessment and management. Current mapping e. g. of flooding events allows localisation and quantification affected areas, buildings or infrastructure as basis for rescue measures or risk prevention [12].
(d) Indirect Assessment
The city, seen as a human product, is the physical and architectonic reflection of the society that created it [14]. Thus, the data and products indirectly contain additional information. The products presented above refer to land cover, which is defined as the physical material on the surface, while land use refers to the human activity that takes place on, or makes use of that land.
The fundamental problem for remote sensing is that while there is often a relatively simple and direct relationship between land cover type and detected spectral reflectance, the same is seldom true for land use [15]. Nevertheless, physical parameters like building sizes and heights, roof types, etc. often correlate to the usage of the buildings.
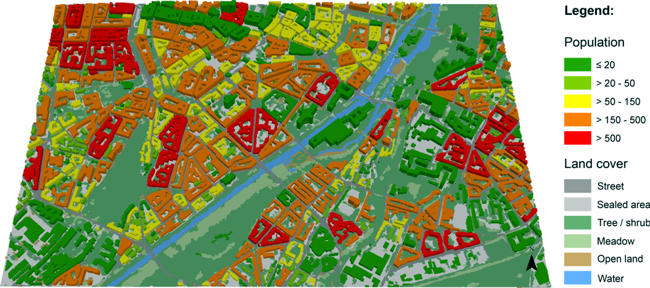
Furthermore it is obvious, that the knowledge on these parameters allows conclusions about the population distribution, even on its spatiotemporal shift within the course of a day. Figure 5 shows a top-down distribution of generalized population data on city level onto the spatial unit of blocks. In addition, in depth analysis aims at correlation of space-oriented information and socio-scientific survey data.
Thus, interrelationships between subjective indicators, like “estimated and measured distance to the urban center” as well as objective indicators, like “Measured vegetation fraction and the felt lack of green space of residents” in dependence of location and urban morphology can be analysed to assess life quality [16].
Further inter-disciplinary cooperation allows indirect value-adding to remotely sensed products: Examples are the usage of local time-dependent population information for traffic simulation [18]; the spatial analysis of the structural alignment of the urban morphology to prioritize areas appropriate for investment in local heating systems [19]; the correlation of building parameters to punctual stability analysis of civil engineers for area-wide building vulnerability extrapolation and assessment respectively [20]; the transfer of potential building and infrastructure damage due to natural hazards into economic losses [21]; the usage of change detection information and urban morphology parameters as input data for climate simulations or urban growth modelling [22]; the support of epidemiologic or medical questions like localizing areas for malaria infection, typically highly dense built-up areas, close to water areas [23].
Pros and Cons of Applying Remote Sensing to Planning Practice
The constantly increasing availability and accessibility of modern remote sensing technologies provides new opportunities for a wide range of urban applications such as mapping and monitoring of the urban environment (land cover, land use, morphology, urban structural types), socio-economic estimations (population density, life quality), characterization of urban climate (microclimate, human health conditions), analysis of regional and global impacts (climate modelling, urban heat islands) or urban security and emergency preparedness (sustainability, vulnerability).
Thus, the high potential of earth observation data, methods and products to support urban and regional planning is beyond controversy. But why did these applications using remotely sensed data to date only rudimentarily expand into the field of urban planning?
In general the authors experienced, at least with German city administrations, a knowledge gap between the stakeholder’s data requirements or operational procedures and the progress applying remote sensing to urban planning. But closing this knowledge gap does not seem to be the single path to a common future.
Still today, one major constraint is costs: the data costs are often too high for local authorities. While satellite data are relatively low priced, some applications need high temporal repetition rates, where airborne and thus cost-intensive remote sensing is required.
Furthermore the investment in processing is still comparatively high due to mostly not fully automation of classification procedures. During processing adjustments are needed due to different atmospheric conditions, land cover types or different user’s requirements or the algorithms are still in experimental status, for example. Missing data standards or compatibility of software add to it.
Another constraint is the difference between requirements and capabilities regarding accuracy of the products: the synoptic overview of remote sensing in the previous chapter shows area-wide and spatially highly detailed information extraction, but the accuracy of cadastral data sets is not achieved. On the one hand accuracies of 80-90 % and sometimes even higher provide an objective basis for decisions. On the other hand these earth observation products are not established at the current legal foundation and now need to find juristic acceptance.
So does remote sensing have essential value to urban planning? In general the data and products are independent, up-to-date, basically available from anywhere around the globe and the products are reproducible and thus consistent and comparable. Especially in developing countries, remote sensing data often are the only data source.
The example of the tsunami and earthquake prone city of Padang in Indonesia shows the value of remote sensing: Using multi-sensoral earth observation a multidimensional view on the city and its vulnerability was produced independently and its quantitative and thus objective information products form the basis for the future risk mitigation plan [24].
But how about countries where spatial data sets in high quality already exist? The strength of remote sensing is the multidimensional perspective allowing for spatial and quantitative statements – from a physical, demographic, social, economic and environmental view. And the analysis is not restricted to administrative artificial boundaries, thus theoretically enabling the analysis on a regional, national or continental scale.
Beyond that, products can be produced on cross-community level. Thus, an advantage arises from comparisons between cities as basis to learn from other examples and to develop solutions not solely on the knowledge of a single city. In interdisciplinary projects the strength arises through correlation of often punctual knowledge with the area-wide availability of remote sensing products, enabling the extrapolation of information.
Remote Sensing and Urban Planning: A Common Future?
What defines our city? How is the city arranged spatially? How dynamic is the urban environment changing over time? Where are traffic hot spots? Where are climatologically and socially the best neighbourhoods? How many people live there? Urban planers need answers on these space-oriented questions and many more. Remote sensing has the unique capability to support decision-making with spatial, quantitative data and information products on various topics, from the extraction of urban morphology to the detection of urban growth, surface temperatures, to monitoring of traffic or assessment of population.
As the concluding question arises: do remote sensing and urban planning have a common future? In fact, both disciplines can learn and profit from each other. Thus it is up to all involved parties – politicians, stakeholders, industry, science and even the residents themselves – to overcome the problem of isolated approaches and to initiate an inter- and trans-disciplinary discussion and cooperation.
The willingness for an open dialogue about expectations, requirements, capabilities and limitations beyond established communities could serve as a ground-breaking step to transfer remote sensing products into value for urban planning. On these premises we have a good chance to transfer innovative ideas into sustainable solution for liveable cities of tomorrow.
——————————————————————————————————–
H. Taubenböck & S. Dech – German Remote Sensing Data Center (DFD), German Aerospace Center (DLR), 82234 Wessling-Oberpfaffenhofen, Germany.
References from the upcoming book:
 Taubenböck, H. & Dech S. (Eds.) (2010): Fernerkundung im urbanen Raum – Erdbeobachtung auf dem Weg zur Planungspraxis. WBG – Wissenschaftliche Buchgesellschaft Darmstadt. To be published – September 2010.
——————————————————————————————–
[1] Reiss-Schmidt: München: Wachstum nach Innen − Nachhaltige Stadtentwicklung zwischen Wandel und Identität.
[2] Heiden, U. & Heldens, W.: Automatische Erkennung von Oberflächenmaterialien städtischer Objekte.
[3] Kurz, F., Rosenbaum, D., Leitloff, J. & Reinartz, P.: Satelliten- und luftgestütze Verkehrserfassung.
[4] Hinz, S.: Automatische Analyse von Menschenmassen aus Luftbildsequenzen.
[5] Wurm, M. & Taubenböck, H. (a): Das 3D-Stadtmodell als planungsrelevante Grundlageninformation.
[7] Ruppert, T., Sparwasser, N. & Taubenböck, H.: Temperatureffekte in der Stadt-Umland Region München.
[9] Schmitt, A.: Änderungserkennung in Radaraufnahmen – Die Aufbauarbeiten zum Münchner Oktoberfest.
[10] Taubenböck, H., Heiden, U., Heldens, W., Wurm, M.: Physische Indikatoren für die Stadtplanung.
[11] Esch, T.: Erfassung und Bewertung der Bodenversiegelung.
[13] Wurm, M. & Taubenböck, H. (b): Fernerkundung als Grundlage zur Identifikation von Stadtstrukturtypen.
[16] Wurm, M., Goebel, J. & Wagner, G.G.: Integration raumrelevanter Indikatoren in sozial- und verhaltenswissenschaftliche Analysen.
[17] Wurm, M. & Taubenböck, H. (a): Abschätzung der Bevölkerungsverteilung mit Methoden der Fernerkundung.
[19] Geiss, C., Nast, M., Schilling, C., Taubenböck, H., Esch, T. & Wurm, M.: Potenzialmodellierung von Wärmenetzen basierend auf höchst aufgelösten Fernerkundungsdaten.
[22] Heldens, W. & Heiden, U.: Analyse stadtklimatischer Aspekte auf Basis von Hyperspektraldaten.
Other References
[6] Van De Griend, A.A. & M. Owe (1993): On the Relationship Between Thermal Emissivity and the Normalized Difference Vegetation Index for Natural Surfaces. − Int. J. Rem. Sens., 14: 1119−1137.
[8] Herold, M., Scepan, J., & Clarke, K. C. (2002). The use of remote sensing and landscape metrics to describe structures and changes in urban land uses. Environment and Planning A, 34, 1443–1458.
[12] Bundesamt für Bevölkerungsschutz und Katastrophenhilfe (BBK) (Hrsg.) (2010): Verwundbarkeitsassessment gegenüber Hochwasserereignissen auf kommunaler Ebene. (= Schriftenreihe Praxis im Bevölkerungsschutz, Bd. 4).
[14] Gonzalez, R. R. & Medina, J. S. (2004): Theories, Models and Urban Realities. From New York to Kathmandu. In: Dela 21, pp. 64-81.
[15] Barnsley, M, Möller-Jensen, L & S. Barr (2000): Inferring Urban Land Use by Spatial and Structural Pattern Recognition. − Donnay, J., Barnsley M, & P. Longley (Ed.): Remote Sensing and Urban Analysis. Taylor and Francis, London: 115−141.
[18] Nagel, K., Grether, G., Beuck, U., Rieser, M., Chen, Y. & K. W. Axhausen (2008): Multiagent Transport Simulations and Economic Evaluation. − Lebaron & P. Winkler (Eds.): Special Issue on Agent Based Models for Economic Policy Advice. Journal of Economics and Statistics (Jahrbücher für Nationalökonomie und Statistik), 228(2/3): 173–194.
[20] Taubenböck, H., Münich, C., Zschau, J., Roth, A., Dech, S. & Mehl, H. (2009a): Assessing building vulnerability using synergistically remote sensing and civil engineering. In: Krek, Rumor, Zlatanova & Fendel (eds). “Urban and Regional Data Management”, Taylor & Francis Group, London, ISBN 978-0-415-55642-2. pp. 287-300.
[21] Kreibich, H., Seifert, I., Merz, B. & A. Thieken (2008): FLEMOcs − A New Model for the Estimation of Flood Losses in Companies. − Hydrological Sciences Journal.
[23] Dhiman, R. (2000): Remote Sensing: A Visionary Tool in Malaria Epidemiology. − ICMR Bulletin, 30(11): 5.
[24] Taubenböck, H., Goseberg, N., Setiadi, N., Lämmel, G., Moder, F., Oczipka, M., Klüpfel, H., Wahl, R., Schlurmann, T., Strunz, G., Birkmann, J., Nagel, K., Siegert, F., Lehmann, F., Dech, S., Gress, A., Klein R. (2009b): Last-Mile preparation for a potential disaster – Interdisciplinary approach towards tsunami early warning and an evacuation information system for the coastal city of Padang, Indonesia. In: Natural Hazards and Earth System Sciences. vol. 9, pp. 1509-1528. http://www.nat-hazards-earth-syst-sci.net/9/1509/2009/nhess-9-1509-2009.html
About the Authors:
Hannes Taubenböck received his diploma degree in geography with minors remote sensing, GIS and environmental planning from the Ludwig-Maximilians-University München (Germany) in 2004. He joined the German Remote Sensing Data Center (DFD) at the German Aerospace Center (DLR) in 2005, working on the topic “Mega cities and Natural Disasters”. He received his Ph. D. from the Julius-Maximilians University of Würzburg (Germany) in 2008. In 2007 he joined the University of Würzburg lecturing and working on manifold projects in the urban remote sensing domain. In 2010 he returned to DLR-DFD focusing mainly in the fields of urban structure analysis, comparative urban studies and risk and vulnerability assessment.
Stefan Dech received his diploma degree in geography, sociology and political science in 1987 and his Ph. D. in geography in 1990, both from University of Wuerzburg (Germany). From 1987 to 1998 he was employed as a researcher at the German Aerospace Center’s Remote Sensing Data Center (DLR-DFD) of which he became director in 1998. Additionally, he has been lecturing since 1991 at the Universities of Eichstaett, Muenchen and Wuerzburg. Since 2001 he holds the Chair of Remote Sensing at University of Wuerzburg. His scientific interests are mainly in the fields of terrestrial remote sensing (biophysical parameters, land cover, urban areas, development of early warning systems for natural hazards).