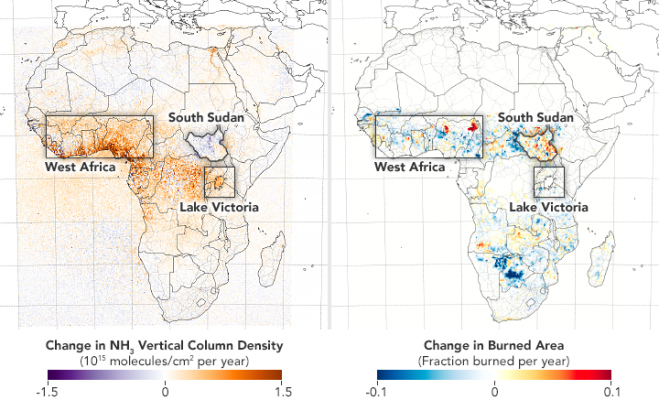
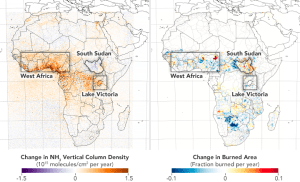
The map on the left depicts the change in ammonia concentration in three regions of Africa from 2008 to 2018. The map on the right shows changes in burned area between 2008 and 2018. (Credit: NASA’s Earth Observatory/Joshua Stevens)
A new NASA-led study is the first to document changing atmospheric ammonia (NH3) concentrations in Africa over an extended period. Ammonia is an air pollutant that can lead to heart- and lung-related illness. When present in excess in an ecosystem, it can make soil more acidic and hinder plant growth.
Ammonia is emitted naturally from soils and vegetation fires, but agricultural activities such as raising livestock and using fertilizer are also major sources. As agriculture scales up to meet the needs of growing populations, it is likely that ammonia emissions will rise too. To create this current view of ammonia emissions, the researchers used satellite data from 2008 to 2018, identifying rises and falls in ammonia concentrations across the continent and the likely causes of those changes.
“We’ve shown here that we can use satellite data to observe trends and monitor emissions of ammonia in specific regions, linked to specific activities or environmental events,” said Enrico Dammers, a scientist at the Netherlands Organization for Applied Scientific Research and co-author of the paper.
The team used satellite data observed by the European Space Agency’s Infrared Atmospheric Sounding Interferometer (IASI), which covers the entire planet at a resolution of about 7.5 by 7.5 miles (12 by 12 kilometers), allowing scientists to observe specific areas of interest.
Their study was published in the journal Atmospheric Chemistry and Physics.