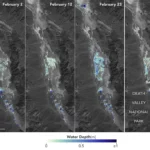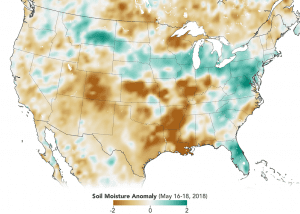
In this map created with SMAP data from May 16-18, 2018, soils that are wetter than normal are seen in greens, while those that are drier than normal are seen in browns. (Credit: Joshua Stevens/NASA Earth Observatory)
Data from the first NASA satellite mission dedicated to measuring the water content of soils is now being used operationally by the U.S. Department of Agriculture to monitor global croplands and make commodity forecasts.
The Soil Moisture Active Passive (SMAP) mission launched in 2015 and has helped map the amount of water in soils worldwide. Now, with tools developed by a team at NASA’s Goddard Space Flight Center in Greenbelt, Md., SMAP soil moisture data is being incorporated into the Crop Explorer website of the USDA’s Foreign Agricultural Service, which reports on regional droughts, floods and crop forecasts. Crop Explorer is a clearinghouse for global agricultural growing conditions, such as soil moisture, temperature, precipitation, vegetation health and more.
“There’s a lot of need for understanding, monitoring and forecasting crops globally,” said John Bolten, research scientist at Goddard. “SMAP is NASA’s first satellite mission devoted to soil moisture, and this is a very straightforward approach to applying that data.”
Variations in global agricultural productivity have tremendous economic, social and humanitarian consequences. Among the users of this new SMAP data are USDA regional crop analysts who need accurate soil moisture information to better monitor and predict these variations.