")
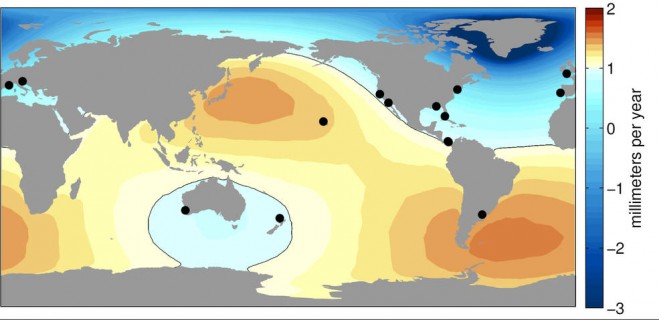
A map shows sea-level change resulting from Greenland ice melt, derived from NASA GRACE measurements. Black circles show locations of the best historical water-level records, which underestimate global average sea-level rise due to Greenland melt by about 25 percent. (Credit: University of Hawaii/NASA-JPL/Caltech)
A new study using NASA satellite data finds that tide gauges—the longest and highest-quality records of historical ocean water levels—may have underestimated the amount of global average sea-level rise that occurred during the 20th century.
A research team led by Philip Thompson, associate director of the University of Hawaii Sea Level Center in the School of Ocean and Earth Science and Technology, Manoa, evaluated how various processes that cause sea level to change differently in different places may have affected past measurements. The team also included scientists from NASA’s Jet Propulsion Laboratory, Pasadena, Calif., and Old Dominion University, Norfolk, Va.
“It’s not that there’s something wrong with the instruments or the data,” said Thompson. “But for a variety of reasons, sea level does not change at the same pace everywhere at the same time. As it turns out, our best historical sea-level records tend to be located where 20th century sea-level rise was most likely less than the true global average.”
One of the key processes researchers looked at is the effect of “ice melt fingerprints,” which are global patterns of sea-level change caused by deviations in Earth’s rotation and local gravity that occur when a large ice mass melts. To determine the unique melt fingerprint for glaciers, ice caps and ice sheets, the team used data from NASA’s Gravity Recovery and Climate Experiment (GRACE) satellites on Earth’s changing gravitational field, and a novel modeling tool (developed by study co-author Surendra Adhikari and the JPL team) that simulates how ocean mass is redistributed due to ice melting.
One of the most fascinating and counter-intuitive features of these fingerprints is that sea level drops in the vicinity of a melting glacier, instead of rising as might be expected. The loss of ice mass reduces the glacier’s gravitational influence, causing nearby ocean water to migrate away. But far from the glacier, the water it has added to the ocean causes sea level to rise at a much greater rate.
Click here to read the full paper.