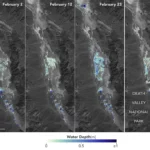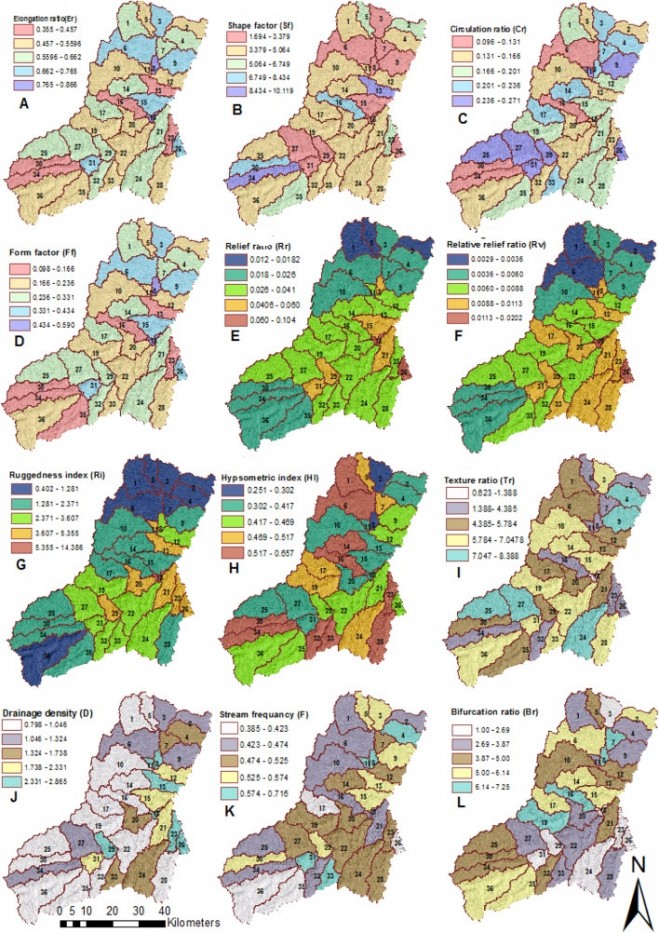

A graph shows various factors that affect the Wadi Watir valley’s ability to drain floodwater. For example, drainage density measures how well a watershed drains into stream channels.
Researchers from UT Dallas and other universities developed geospatial science methods to help the Egyptian government determine how to avoid flooding in a coastal mountain region. The government wants to develop the area for tourism, but flash flooding and associated hazards have hampered efforts, according to Dr. May Yuan, Ashbel Smith professor of GIS.
“We developed methods to combine all the environmental factors associated with flash flooding and created a model to identify the high- and low-risk areas,” she said.
Yuan conducted the research, published in the Journal of Arid Environments, with co-authors from other universities in the United States and Egypt. The study focused on Nuweiba, a town on the east coast of Egypt’s Sinai Peninsula, and its surrounding area where flooding threatens economic growth. The region is hot and dry during the summer, and gets heavy rain in the winter.
Researchers analyzed satellite imagery, conducted fieldwork and used other tools to determine a variety of factors that affect flooding, including rainfall and runoff patterns, flooding history, soil types, geology, vegetation, erosion, steepness of the mountains and land elevation. By layering all the features on one map, scientists developed a GIS model to identify the most-vulnerable areas. The assessment could be used to help officials make decisions regarding flood prevention and land use.