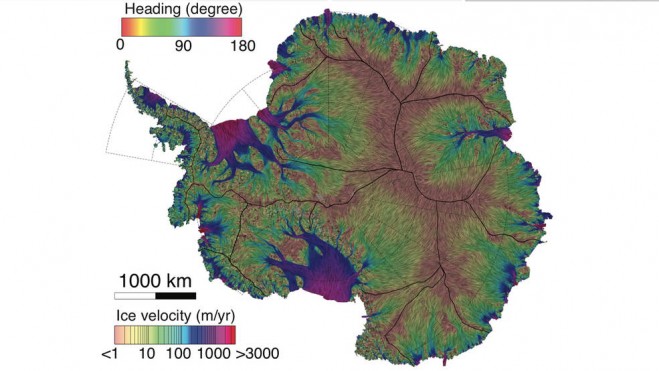
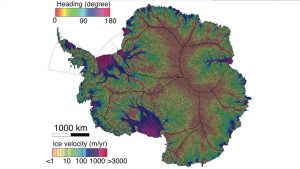
This new NASA/UC Irvine map of ice velocity in Antarctica is 10 times more accurate than any previous map and shows flows over 80 percent of the continent, where older maps showed about 20 percent. Colored lines indicate direction of flow; background colors show speed. (Credit: UCI/Jeremie Mouginot)
Far more accurate than any previous map, this new representation of glacier flows in Antarctica opens the door to an improved understanding of the vast continent and the future pace of sea-level rise. To create the new map, researchers at the University of California, Irvine, and NASA’s Jet Propulsion Laboratory in Pasadena, Calif., combined input from six different satellite missions dating from 1994 to the present.
All earlier maps of glacier flow speeds have estimated the speeds largely by tracking the movement of visible features like patches of dirt on the ice surface, but these new maps rely mainly on observations that use a technique called synthetic aperture radar interferometry, which is much more sensitive to the motion of the ice itself. By combining observations from multiple satellites passing over the continent in different directions, the researchers produced a map that is not only 10 times more accurate than any previous map but also shows speeds for far more of the slow-moving ice on the continental interior than ever before.