 Good management decisions require the availability of quality information. For forest resource managers, the combination of airborne Light Detection And Ranging (lidar) remote sensing data together with Esri’s ArcGIS and the Forest Service, U.S. Department of Agriculture’s own FUSION software have created a powerful 3D environment capable of modeling a forest’s canopy structure.
Although still a relatively new approach, this combination of data and software provides the necessary environment to store, organize, extract, share and analyze forest land cover information in ways that were impossible just a few years ago. In addition, creating regression models between forest inventory parameters measured on field plots and correlating lidar canopy metrics provides a new and robust ability to better understand the information contained within the lidar point cloud across the entire forest landscape.
Beginning with ArcGIS 9.3.1, Esri’s lidar users began leveraging this new 3D data source in conjunction with the rest of their GIS data. Enhancements followed in 10.0, and with the recent release of 10.1, ArcGIS users can now store, organize, display and share their lidar point clouds utilizing the native lidar file format (.las), generally referred to as a “las file”. Working with native .las files has historically been a challenge for lidar users as these files tend to be very large in size, often more than 100 MB and hold millions of 3D data points, collectively known as “point clouds”. The enhancements for lidar support in ArcGIS 10.1 are significant for a number of reasons, including the ability to retain all of the valuable metadata that resides within the .las file structure such as point classification, point return number, the lidar point intensity values and possibly RGB values (from simultaneously acquired color images) correlated to individual points. This new functionality also eliminates the requirement to convert .las files into Multipoint format, saving both the time to convert the data files as well as the additional storage requirements.
Also included with 10.1 lidar support is the ability to organize and manage the relatively large number of data files associated with a typical lidar collection. This is accomplished by utilizing the new “LAS Dataset” (.lasd), a file based approach which stores references to the .las files on disk and treats a collection of .las files as one logical dataset. The ArcGIS “Mosaic Dataset”, originally designed to catalog, process, visualize and share imagery has now been enhanced to provide many of the same capabilities to native lidar data. The new functionality provides an efficient method for multiple users to access, explore, and download lidar point cloud data. In addition 10.1 provides users the ability to visualize point clouds within ArcMap, examine 3D profiles, and interactively edit individual point classifications.
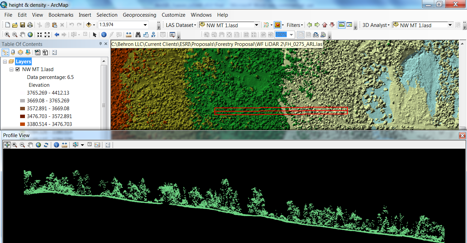
Figure 1 shows an example of ArcMap (10.1) displaying the point cloud and profile view.
The FUSION software was introduced around 2005 and is currently managed by Robert McGaughey of the USDA Forest Service – Pacific Northwest Research station to help the forestry community understand, explore and analyze lidar data (McGaughey 2012). Initially FUSION was capable of selecting subsets from the lidar point cloud and interactively viewing them in 3D as depicted in Figure 2.
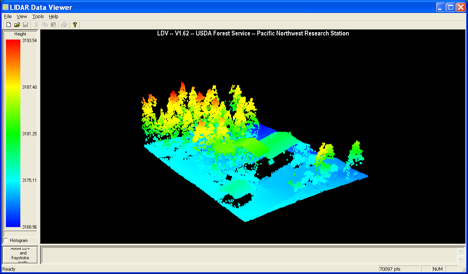
Figure 2: FUSION’s Lidar Data Viewer (LDV) allows you to visualize and explore point clouds in a 3D environment with a variety of display options.
As research and interest in using lidar technology to quantify vegetation has evolved, FUSION’s capabilities have been enhanced to include the extraction of lidar point clouds to correlate with forest inventory plots and the ability to calculate a collection of canopy metrics such as height statistics or cover/density ratios (Table 1), which can be summarized to a plot level or grid cell format. In addition, FUSION possesses a quality assessment routine catered to assessing the appropriateness of lidar point data for forestry applications.
Table 1: Groups of lidar canopy metrics generated by FUSION (McGaughey 2012):
| Category | Output variable |
| Descriptive | Total number of returns Count of returns by return number Minimum Maximum Mean Median (output as 50th percentile) Mode Standard deviation Variance Coefficient of variation Interquartile distance Skewness Kurtosis AAD (Average Absolute Deviation) L‐moments (L1, L2, L3, L4) L‐moment skewness L‐moment kurtosis |
| Height percentile values |
(1st, 5th, 10th , 20th, 25th, 30th, 40th, 50th, 60th, 70th, 75th, 80th, 90th, 95th, 99th percentiles) |
| Canopy related metrics (calculated when the “/above:#” switch is used |
Percentage of first returns above a specified height (canopy cover estimate) Percentage of first returns above the mean height/elevation Percentage of first returns above the mode height/elevation Percentage of all returns above a specified height Percentage of all returns above the mean height/elevation Percentage of all returns above the mode height/elevation Number of returns above a specified height / total first returns * 100 Number of returns above the mean height / total first returns * 100 Number of returns above the mode height / total first returns * 100 |
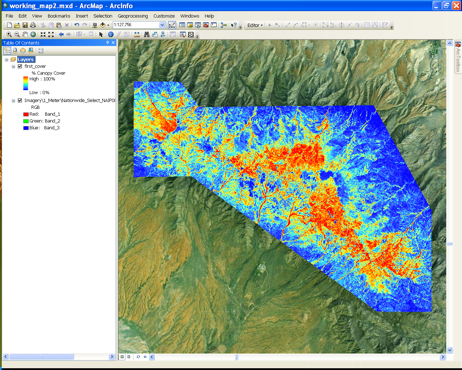
The combination of ArcGIS and FUSION software creates a complete work environment enabling efficient management and processing of lidar data sets for forestry applications. Where ArcGIS excels in the organizing, storing and sharing of lidar point clouds, FUSION provides a robust ability to perform extensive point cloud analytics of forest inventory variables across large landscapes. The information FUSION can extract to describe the forest canopy (Table 1) can easily be exported as an ASCII grid and imported into ArcGIS alongside other GIS datasets and used for decision making and further analysis as illustrated in Figure 3. To get more value out of our FUSION outputs, the ArcGIS Spatial Analyst’s Conditional Tool can be used to identify areas of interest that meet certain criteria. For example, if interest exists in areas that contain large trees (tall) with a relatively low canopy cover, pixels can be identified that meet both conditions by applying the conditional logic to the appropriate FUSION generated canopy structure grid layers.
Figure 3: The figure represents the first return % Canopy Cover Grid Metric produced at a 25 meter cell size across approximately 85,000 acres in south east Arizona. All the metrics listed in Table 1 can be exported to a Grid format and integrated into ArcGIS as illustrated in this figure.
Fortunately there is no cost to acquire the FUSION software, so no additional software beyond the standard ArcGIS licenses needs to be purchased to obtain the benefits of adding FUSION to the workflow. The USDA Forest Service Remote Sensing Applications Center (RSAC) provides training and helpdesk support for Forest Service personnel interested in using FUSION software for forest management and provides an on-line tutorial for public reference (http://www.fs.fed.us/eng/rsac/fusion/).
Due in part to high severity fires and insect infestations, a workflow incorporating ArcGIS and FUSION, as highlighted above, was implemented for a forest restoration effort in the Pinaleño Mountains on the Coronado National Forest in southeastern Arizona (Mitchell and others, 2012). In order to identify habitat and catalog forest inventory variables at a landscape level, forest inventory parameters were modeled by creating regression models between forest inventory parameters measured on field plots and the correlating lidar canopy metrics which were subset for each plot and summarized using FUSION (Figure 4).
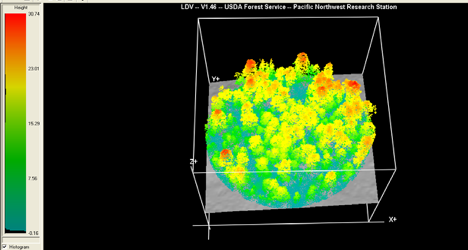
Figure 4: FUSION was used to create a subset from the lidar point cloud that correlated with each field plot location and size across the study area (depicted above). Four input data sources were necessary to complete the processing: plot coordinates (sub meter accuracy), plot radius, the lidar-generated bare earth surface covering the project area, and the raw lidar data tiles (.las files). Statistics (Table 1) for each virtual lidar plot were then calculated as input for the inventory parameter regression modeling.
Before applying the resulting statistical models to the landscape, a series of GIS procedures were conducted to ensure the models were applied appropriately and successfully across the landscape. First, a forest-non forest mask was created to ensure the models were only applied in forested areas. This was accomplished using the Spatial Analyst Conditional Tool in ArcGIS and the canopy height and canopy cover structure grid layers output from FUSION. Each pixel had to meet a minimum vegetation height of 3 meters and 2 percent canopy cover. All pixels that did not meet the criteria were masked out when models were applied across the study area. The final step was to apply the regression models created in the initial modeling steps to the appropriate ASCII grid layers which created continuous inventory parameter GIS layers covering the entire study area. Each calculation produced a new grid in which each 25 meter cell spatially represents the estimated forest inventory parameter of interest such as biomass, basal area, Lorey’s mean height, timber volume, etc… (Figure 5).
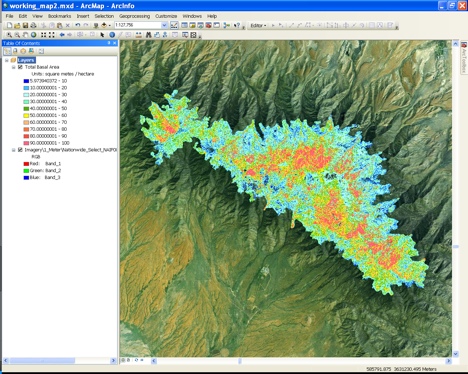
Figure 5: The GIS grid layer (25m cell size) represents the Basal Area inventory parameter model applied at the landscape level. This GIS layer is one of the end user products that will be used for future decision making, analysis and monitoring for the Pinaleño Sky Island study area.
The resulting GIS inventory layers were qualitatively validated with local experts and conformed well to trends known to occur on the landscape. The forest canopy descriptive layers (Table 1) and the modeled forest inventory GIS layers (Figure 5) are currently being incorporated into habitat characterization studies for the endangered Mt. Graham red squirrel, the Pinaleño Demography study, and the general management and conservation of the Pinaleño Sky Island ecosystem. For a complete copy of “Mapping Vegetation Structure in the Pinaleño Mountains Using Lidar – Phase 3: Forest Inventory Modeling” please refer to the following link: http://www.fs.fed.us/rm/pubs_other/rmrs_2012_mitchell_b001.pdf.
Numerous benefits were realized by utilizing lidar over a traditional ground-based approach to obtain forest structure data. First, it provided continuous coverage of all forested areas, rather than stand or plot-level estimates of various parameters created from stratified sampling methods. Second, it sampled areas that field crews could not safely measure due to extreme terrain. Finally, The Coronado National Forest estimates that obtaining data sufficient to implement the Pinaleño Ecosystem Restoration Project would have cost nearly twice as much using traditional methods as the cost of the Pinaleño Lidar Mapping Project.
Using Esri’s ArcGIS and the USDA Forest Service’s FUSION software, forest resource managers now have a set of tools and a reliable workflow for extracting landscape level forest structure information from raw lidar data and incorporating it into their GIS. The workflow has been streamlined with the recent release of ArcGIS 10.1, which includes enhanced functionality for storing, organizing, and sharing lidar .las files. Combining this with the powerful forestry point cloud analytical capabilities of FUSION, it has become easier to manage and extract value from lidar data. The FUSION software, which complements the capabilities of ArcGIS, can be downloaded free of charge (http://forsys.cfr.washington.edu/fusion/fusionlatest.html) and the Forest Service Remote Sensing Applications Center (http://www.fs.fed.us/eng/rsac/) provides tutorials and sample lidar data sets making it easy to get started. With lidar data becoming more affordable and available, software tools such as ArcGIS and FUSION provide foresters with dramatically improved capabilities to understand the forests they are managing and make informed decisions.
References:
McGaughey, R. 2011. FUSION/LDV: software for lidar data analysis and visualization. Version 2.90. Seattle, WA: U.S. Department of Agriculture, Forest Service, Pacific Northwest Research Station [online]. Available http://forsys.cfr.washington.edu/fusion/fusionlatest.html. [http://forsys.cfr.washington.edu/fusion/FUSION_manual.pdf]
Mitchell, B.; Walterman, M.; Mellin, T.; Wilcox, C.; Lynch, A.M.; Anhold, J.; Falk, D.A.; Koprowski, J.; Laes, D.; Evans, D.; Fisk, H. 2012 Mapping vegetation structure in the Pinaleῆo Mountains using lidar-phase 3: forest inventory modeling. RSAC-10007-RPT1. Salt Lake City, UT: U.S. Department of Agriculture, Forest Service, Remote Sensing Applications Center. 17p.
About the co-author: Brent Mitchell is a lidar specialist and training group leader working at the U.S. Forest Service Remote Sensing Applications Center and employed by Red Castle Resources in Salt Lake City, Utah.
