
Earlier in the month I was asked to present at the British Cartographic Society conference on the issues of accurately representing “place” in a 3D model. The concept of ‘place’ (as opposed to simply ‘location’) has been gaining prominence in recent years, with the Association for Geographic Information (AGI) 2009 conference focusing on place as it’s core theme [1]. In the UK there is growing acceptance of the importance of managing the public space (streetscape) as a single entity rather than as a collection of distinct features that just happen to share a physical location. ‘Total Place’ [2] takes this further by looking at the wider efficiencies that can be gained by this joined up approach.
Visualising place is however a challenge as it is not restricted to issues of positional accuracy, but also representation. I have argued in the past [3] that this is an area of confusion which is not being adequately addressed within this industry. We appear to be grappling to find the vocabulary to effectively communicate the accuracy of a 3D model.
What are the issues?
Our clients, CityGRID users, have typically been working with large 3D digital city models for a number of years (some for over a decade). They have identified these models as a vital part of their management strategy for the urban environment, and they have invested heavily in the data, software and staff resources to support them.
So when I heard John Carpenter (Head of Product Management Ordnance Survey) question whether “a national 3D data set [is] a solution looking for a problem?” at the Ordnance Survey Partner Event recently, I admit I was a little put out! I hasten to add that I don’t think that this is his personal view. Rather the sentiment carried in the statement is born out of market research done by the OS at the beginning of the year. Indeed the OS have dedicated considerable effort to the incorporation of 3D in to their product set [4].
What this market research does reveal is the lack of general understanding of where the value of 3D lies. But I also think that by suggesting that 3D is a technology ‘ready and waiting’ the problems that are still to be addressed with the handling of 3D data are glossed over. With the ever wider adoption of 3D to present information across a range of applications, the issues of accuracy of ‘representation’ have become more apparent – yet have not had the level of investigation applied that is common within conventional 2D cartography.
Why 3D?
We live in a 3D world yet representation of that world has to date predominately been a process of abstraction into a 2D format. The output of this process requires interpretation by the viewer which introduces potential for miscommunication.
For applications where there is a need to understand our interaction within a place, such as an urban development projects, accurate presentation of the actual (and planned) environment has become important.
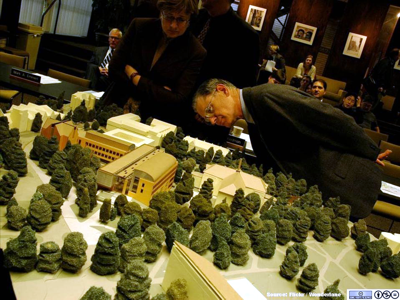
For such projects architects, designers and engineers have always used 3D physical models, realising that drawings are the preserve of the professional and actively disinterest the wider stakeholder community.
But we are now seeing a greater adoption of virtual (digital) 3D city models because of their ability to convey information more effectively than traditional methods.
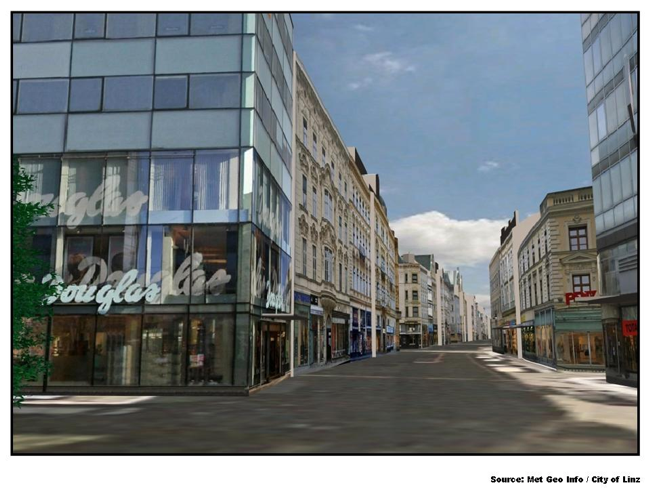
They can add more realism (simulation of shifting light and changing seasons) and more versatile (respond to and incorporate actual or planned change). But more than that, they hold the potential to be a map.
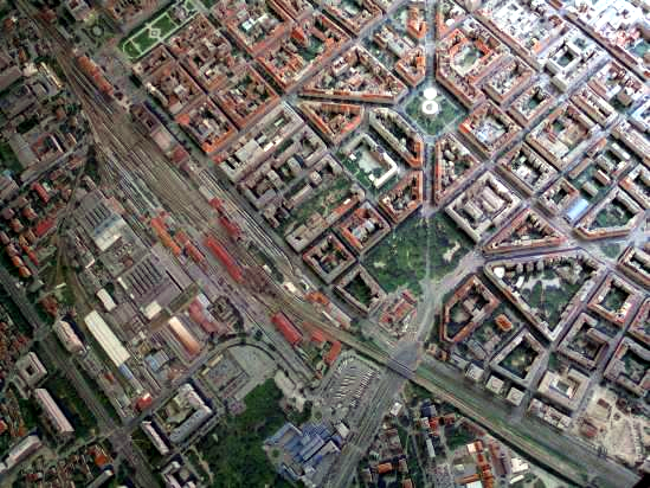
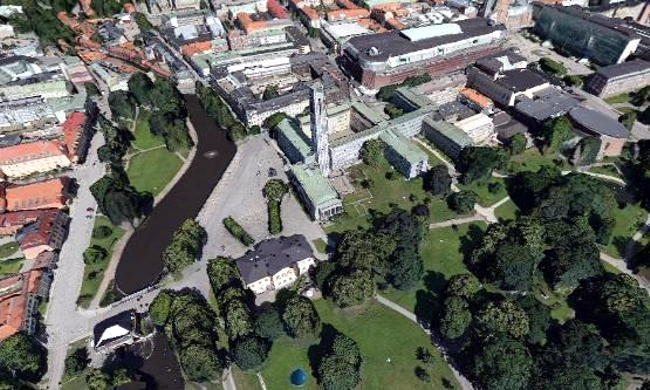
That is to say, that Figure 2 is not simply a picture of a modelled street in Linz, but is a base data layer that can provide added understanding to a range of abstract data sets.
As pressure on our cities develops, there is greater need to consult with an ever wider group of interested parties on the effective use of our diminishing resources. Urban planning is now a multi-disciplinary pursuit – with each set of professionals bringing to the table their own set of understandings. Effective communication between these groups is vital.
Repeated case studies (and I can add our own anecdotal experience to this) have shown that these professionals gain real insight from information presented in 3D. There are sound business drivers behind their adoption: productivity and efficiency are enhanced though the entire lifecycle from design and build to operate and manage.
This “discussion” must be held with the entire stake-holder community . The public is now an integral part of any planning process, empowered as never before by law, technology and expectation to influence development. Early engagement with the public is needed to ensure their understanding of the proposal and thereby reducing potential conflict.
Application
So if 3D is obviously the answer to all our problems, what is the point that John Carpenter is making? Or to put it another way, “what are all our clients doing with their 3D city models?”. Are these models simply nothing more than expensive computer games? I believe that this is exactly what they could become unless the application for the model is at the forefront of the design. The main aim has to be to save money, be it via ‘real savings’ in the design process or long-term management of an asset (be that a city, subway network or a single building), or through improved decision making.
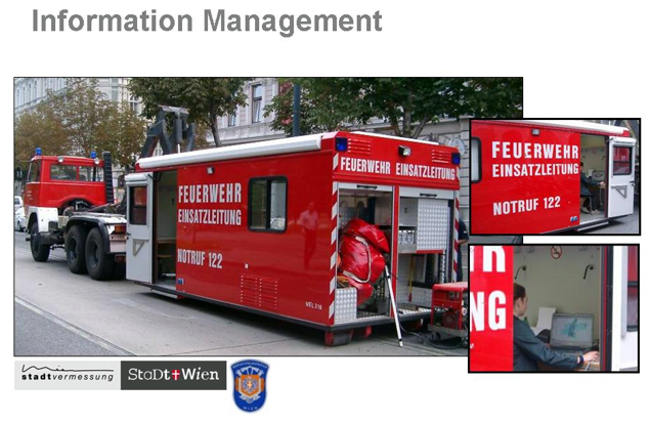
Information Management:
Here the model is being used as a record of the built environment. There is no better means of recording the structure and fabric of an urban area than 3D. It is more intuitive than a map and certainly more interactive, meaning that it can be used as a baseline for other applications such as disaster management. These images show CityGRID being used live in an emergency command centre. This exercise was carried out in the run up to the European Cup (Vienna). Detailed information of buildings (above and below ground) were relayed to ground teams who otherwise would have been acting blind.
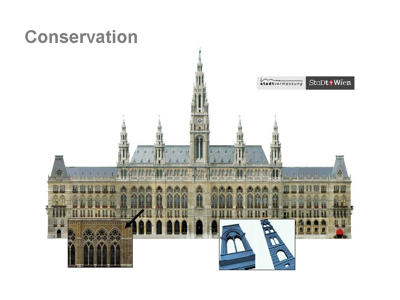
Conservation: The volume of information that can be captured and retained of important buildings is immense. Often these culturally significant buildings have no structural records making the management of them harder to say the least. Here we see a model constructed from a terrestrial laser scan survey being used, amongst other things, for the design of replacement masonry.
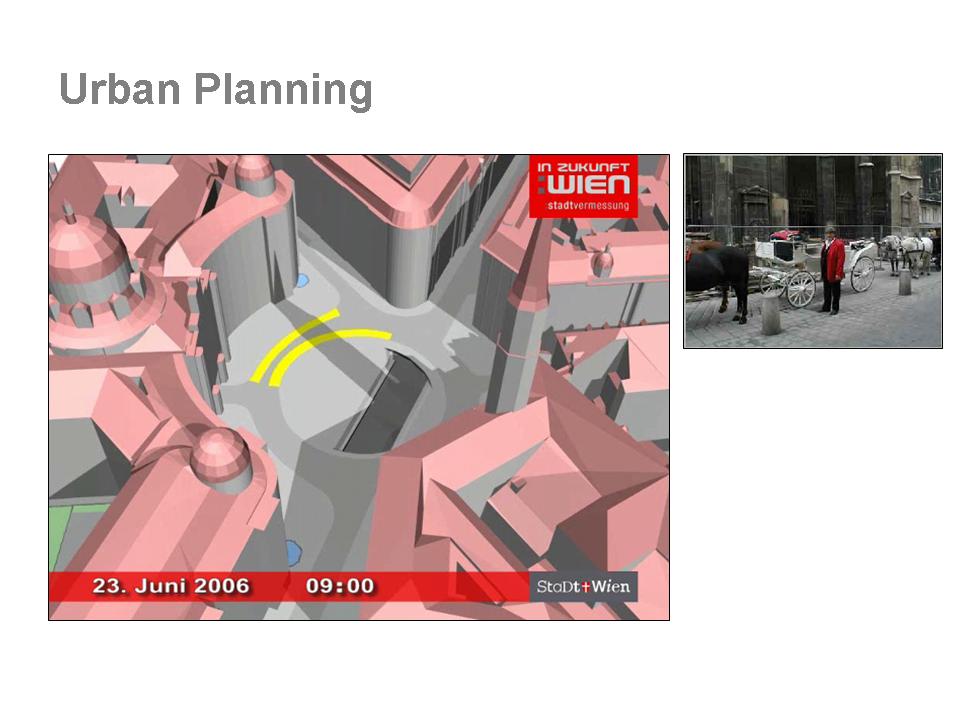
Urban Planning is obviously a ‘catch-all’ description that covers many issues and disciplines, but here I show an extreme example of a model being used actively to assist the decision making process.
Here shadow analysis is being undertaken, not for a ‘right to light’ as we might expect in the UK, but for animal welfare. Specifically they assessed the amount of time spent in the shade by Vienna’s famous horse-drawn taxi’s while waiting at their stands (indicated in yellow).
Public consultation:
Clearly an important element of a 3D model is its visual impression. To be an effective communication tool, especially for non-technical audiences it needs to convey complex information without over simplification, or distraction from the noise of portraying every detail of the real world.
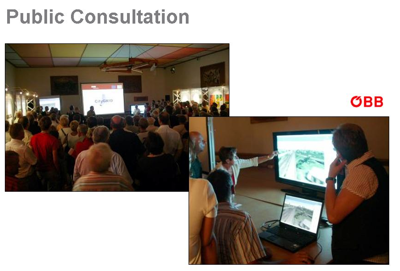
How the audience interacts with the model is an important consideration for its design. In this instance we’re working in a live public consultation meeting for ÖBB (Austrian Federal Railways).
A series of road-shows toured the route of a new high-speed line. Members of the public were given detailed information via the model, but with engineers on hand to address questions and concerns. The aim of the model therefore was realism.
Where we need to interact with the wider community, for example via information booths, the model is simplified to represent the key messages the client needs to convey. Clutter is removed.
And we can reach a wider audience still via the internet. While a useful tool for reaching a mass audience it is not a favoured option for consultation, but is suitable for user led applications such as tourism.
Just to confound my hypothesis however, some of our clients use the digital models simply to generate hard copy output; a case in point is the City of Zagreb that replaced a wood model that had become obsolete and difficult to maintain.
Accuracy:
The accuracy of the model therefore defines its suitability for a proposed application. But discussions of 3D accuracy seem to often ignore positional accuracy in favour of representation.
This is unhelpful, but even if addressed would merely focus on the geometry. For a model to have real value, it can not simply focus on visual characteristics, but must also be semantically correct. The reason for this is that for all of the examples listed above, none of the models was developed with the single application in mind. They are derived works from a base product to meet specific requirements. This is where a structured data model becomes vital.
Accuracy is a factor of a number of criteria. The primary indicator is the positional accuracy of the features. This is generally specified in plan, with Z (where recorded) typically being coarser. For most within the industry this indicator is well understood, but for many involved in the commissioning of city models, it is apparently of little interest.
There is an assumption that the data will be ‘accurate’. Perhaps with the current technologies on offer this is a reasonable expectation? It is not uncommon however for us to have to introduce ‘error’ into the model in order to conform to cadastral records: truth it seems being an inconvenience to the law!
Geometry is where we start defining the appearance of the buildings – and the vagaries begin. Where a 2D map is understood to be an abstraction, there is an expectation that a 3D model is a carbon copy of the actual city.
There are two issues with this. The cost of capture, and the utility of the model. At what point does ‘enhancement’ become ‘noise’? Textures are applied to the surface of the model to add visual clarity – but can also be used to enhance the model through, for example, the identification of windows (of particular value to noise and building thermal efficiency modelling). They offer therefore a very fast and cost effective way of adding real information to a model, without the need to actually model to that level of detail.
The assumption maybe that this lack of clarity leads to poor quality, but a counter example is where the client insisted on the physical capture of all recesses over 10cm deep. Misunderstanding of the issues here lead to an over specification resulting in an expensive and time consuming modelling contact that added nothing of value to the model for its intended purpose. Instead, applying bump mapping to a simplified façade provides an equally engaging street view, which is all that this model was required for: contextual placement of proposed developments
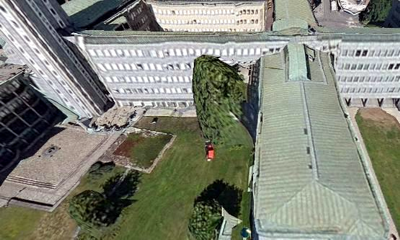
A more extreme example is the visually stunning models produced from C3 technology [5]. This is actually a draped surface: generated at outstanding speed, it is a very good tool for providing an overview of the city. But once zoomed in (Figure 10) we see that the model does not make logical sense. Here the tree is actually incorporated into the fabric of the building. This would render it unsuitable for nearly any analytical purpose. So how do we describe it’s accuracy in a helpful way?
Standards
This is something that standards should help address; which in this particular area of interest that falls to CityGML [6]. Released by the OGC [7] , it is actually supported by the 3DSIG [8] of which Met Geo Info contribute to some of the technical committees. CityGML, unsurprisingly, uses GML (Geographic Mark-up
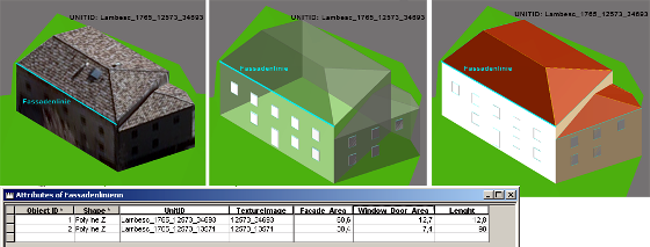
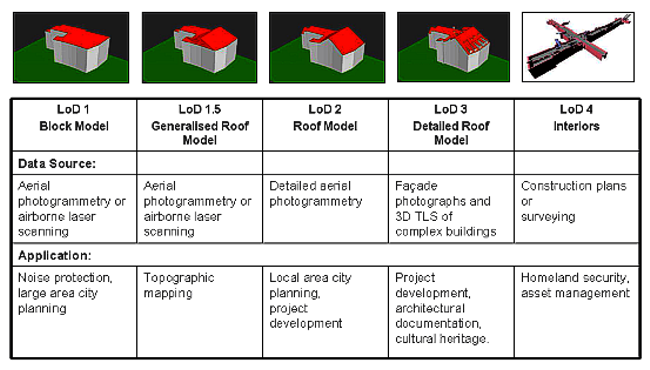
Language) for the geometric descriptions of buildings. The significant element to CityGML however is that it adds semantics to the geometric data. This includes a concept of Levels of Detail (LoD) for buildings.
The LoD is an indication of the precision that the building has been modelled to independent of any positional issues or correspondence with reality. It is also to the discretion of the modeller as to what LoD they apply particular features to (with some guidance provided for size of objects).
Thus the level of granularity varies between models. There are sound reasons for a generic standard to adopt a flexible approach, but it gives the impression of an emerging acceptance of these levels.
There is clearly ambiguity however, and we can see this through the use of sub levels. In no way ‘official’ they show that in general parlance the terms are used flexibly.
Thus LoD1.5 above is being used to described buildings which have a generalised roof-model by applying a best-fit from a library. This is typical of (semi) automated processes especially when LiDAR data is being used as the raw input. The result is significantly cheaper, and visually indistinguishable from a true LoD2 model (where the roof has been modelled from real data) but clearly has a low utility for certain applications. The cynic might conclude this ambiguity was potentially deliberate to elevate the offerings of one technical delivery over another.
CityGML of course also introduces other concepts of importance. There are different classes of model components for describing buildings, terrain, vegetation, city furniture, roads, water bodies and so on. There is also a hierarchy of parts allowing for aggregation into objects. Predictably however many CityGML city models will follow the standard for geometry & appearance so that the data is displayed correctly in CityGML viewers, but will disregard the semantic elements. Visually these models are acceptable, but as tools for analysing and managing the urban infrastructure they are flawed.
To add further to the confusion there is the issue of competing standards, with some questioning the potential uptake of CityGML. The US is a key market for the establishment of any IT standard, but there the alternative approach is gaining momentum in the form of Industry Foundation Classes (IFC) from the school of BIM [9]. Perhaps there is some potential for convergence here, but I am sceptical in light of the protracted and incomplete efforts made to integrate GIS and CAD.
Summary
It is buyer beware out there in the 3D market place. Initiatives such as the Ethical 3D Charter (www.3dok.org)could provide an answer, but they are at such an early stage of development (for that reason – and due to lack of space – I’ve not covered them here). Until then 3D models are set to be used more widely, which will expose the general lack of understanding of data quality, resulting in models that do not meet their core function: to save money. In my opinion this is complicated further by the need to incorporate semantics as well as topology and geometry. This is necessary in order to sensibly represent the urban environment: a building can not simply look like a building, but must also behave as one. Such an approach provides a more meaningful metadata description helping users understand the potential and limitations of the model. 3D as a primary form of information display will happen, but there are some hurdles to over come!
——————————————————————————————
Written by Rollo Home. Operations Director, Met Geo Info
For more information: Met GeoInfo (www.metgeoinfo.com) is a geospatial software development company specialising in 3D digital City Modelling. The CityGRID product suite enables our clients to construct, edit and visualise their city in true 3D. The unique selling position is the vast range of data management functions that allow clients to maintain the currency of their model in line with the actual changes happening on the ground. This protects their investment in the initial capture costs and ensures that the model meets their long-term requirements for the management of complex and massive assets.
References:
[1] Realising the Value of Place
[2] Total Place
[5] C3 Technology
[6] CityGML
[7] Open Geospatial Consortium (OGC)
[8] University of Bonn – 3D SIG
[9] Building Smart